
MaNGA ds9 Tutorial
This tutorial will use the MaNGA galaxy 12-193481 (PLATE-IFU = 7443-12703). You can download this galaxy yourself with the following rsync command in your terminal:
rsync -avz rsync://data.sdss.org/dr17/manga/spectro/redux/v3_1_1/7443/stack/manga-7443-12703-LOGCUBE.fits.gz [LOCAL_PATH]
One of the simplest ways to quickly visualize a MaNGA datacube is to use ds9. This is a common astronomy software package that can be downloaded here and is also a package in astroconda. Keep in mind that ds9 will allow you to look at the data, but not really analyze the data in detail. If you want to do more advanced analysis, look at the Marvin, IDL or python sections.
Viewing a datacube
Opening a datacube in ds9 can be done by typing the following into your terminal:
ds9 manga-7443-12703-LOGCUBE.fits.gz &
This command will open the first extension (‘FLUX’) by default. If you want to look at other extensions, you will need to add the extension name to the end of your ds9 command, e.g.,
ds9 manga-7443-12703-LOGCUBE.fits.gz['IVAR'] &
Alternatively, you can also open MaNGA data cubes from within the DS9 application by choosing File -> Open As -> Multiple Extension Frames (which will open all extensions of the data cube at once). Note that you may have to click the ‘Options’ button within the open file dialog box in order to enable opening the gzipped MaNGA FITS files (since ds9 does not give you the option to open these by default). An overview of the various extensions of the MaNGA datacube format is given in its data model.
When opening a datacube in ds9, you will be able to play a movie (should be a pop-up window), stepping in wavelength slices through the cube. This can be very useful to give you a first impression of a datacube, and see where for example emission lines appear. You can adjust the speed of the movie, or pause it when you want to look in more detail at a particular slice. Also you can change the zoom and scale by selecting the appropriate buttons. To change the range of the scale (e.g. minimum and maximum values), right click with your mouse and move the cursor back and forth.
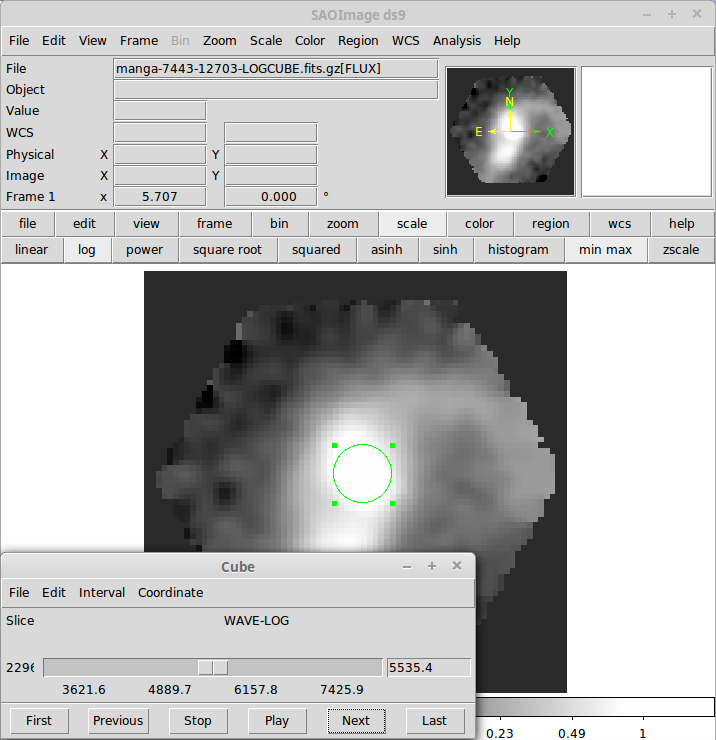
Viewing a spectrum
If you would like to view the spectrum at a given position, you can click and drag on the ds9 window to draw a circle over the region of interest. To draw a region, go to ‘edit’ then click on ‘region’, this will allow you to draw a region, like a circle on the image. Then double click on the region and a new window should pop up giving some basic parameters of the region. Under the ‘Analysis’ tab on the new window, you can select ‘Plot 3D’. Then a spectrum of the region should be displayed in another new window. You can then move and alter the region and the spectrum will be automatically updated. Note: many times there are more options under the tabs at the top then using the buttons with the same name.
For more tips and ways to use ds9 for visualization and simple analysis, please visit the ds9 home page

