
Scope
Overview
Data Release 17 is the fifth and final data release of the fourth phase of the Sloan Digital Sky Survey. It includes SDSS data taken through January 2020, and encompasses more than one-third of the entire celestial sphere. The coverage figures below show the sky coverage of DR17 for the eBOSS, APOGEE, and MaNGA surveys respectively (click figure to enlarge).
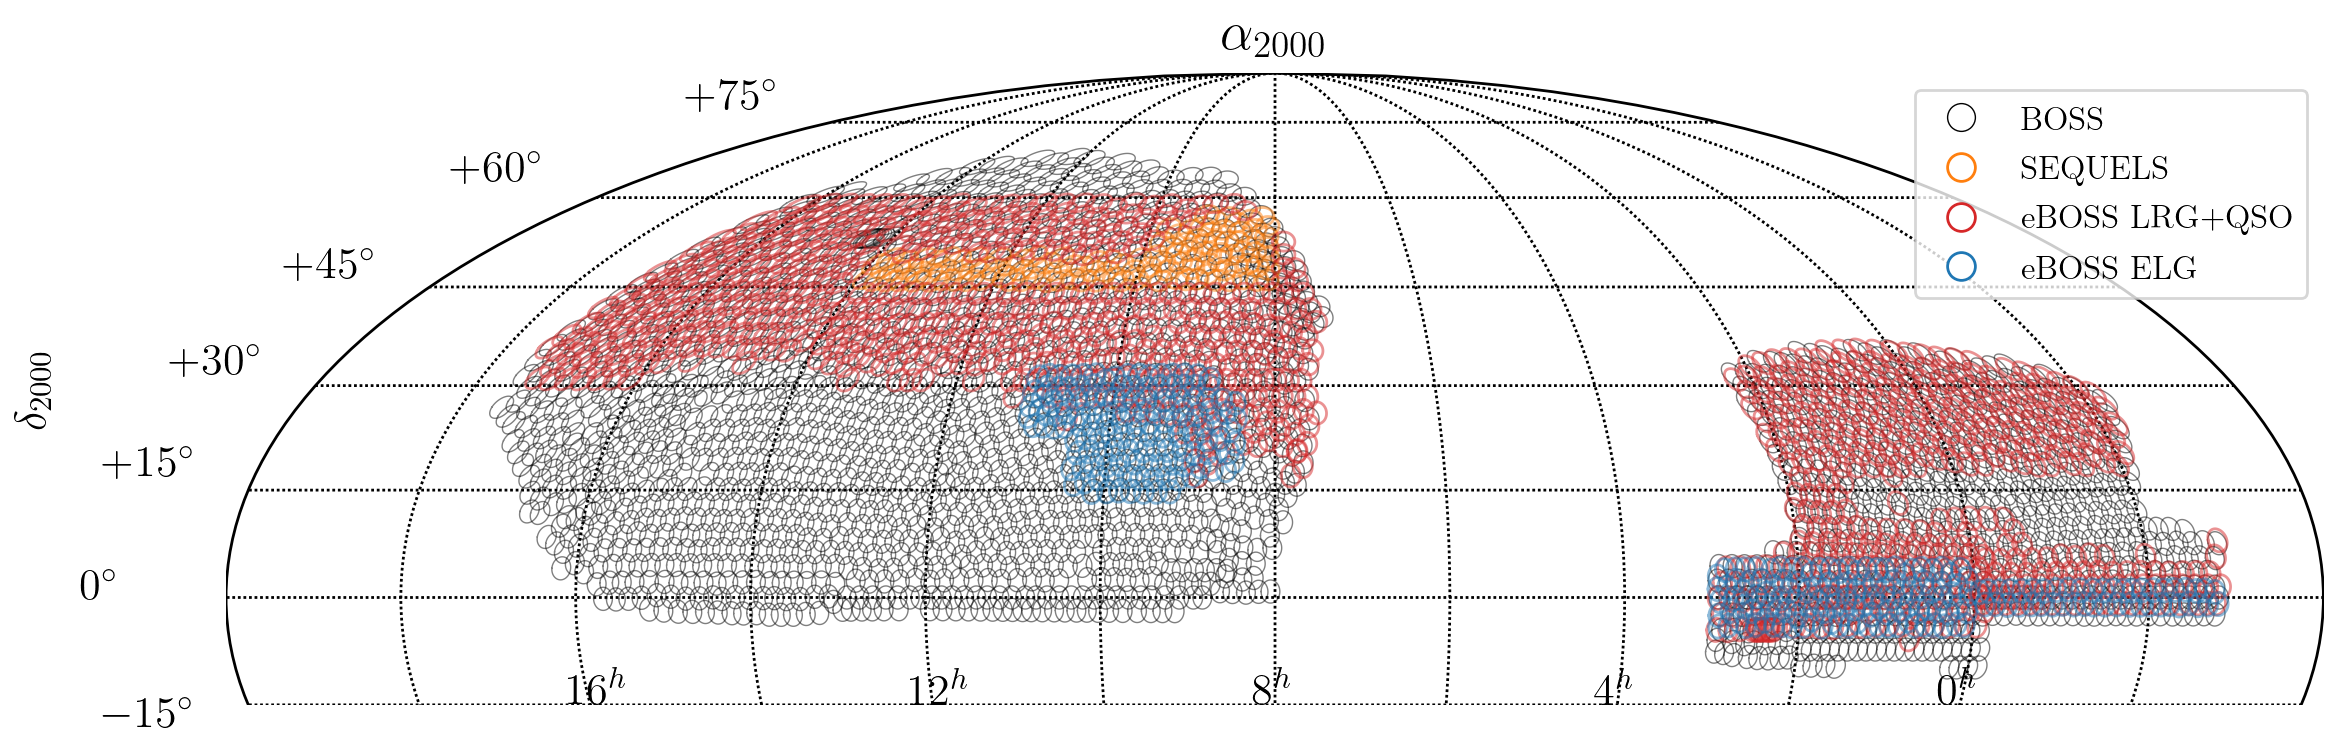
DR16 eBOSS spectroscopic coverage in Equatorial coordinates (plot centered at RA = 8h). In DR17, 7 eFEDS plates were added to this footprint.
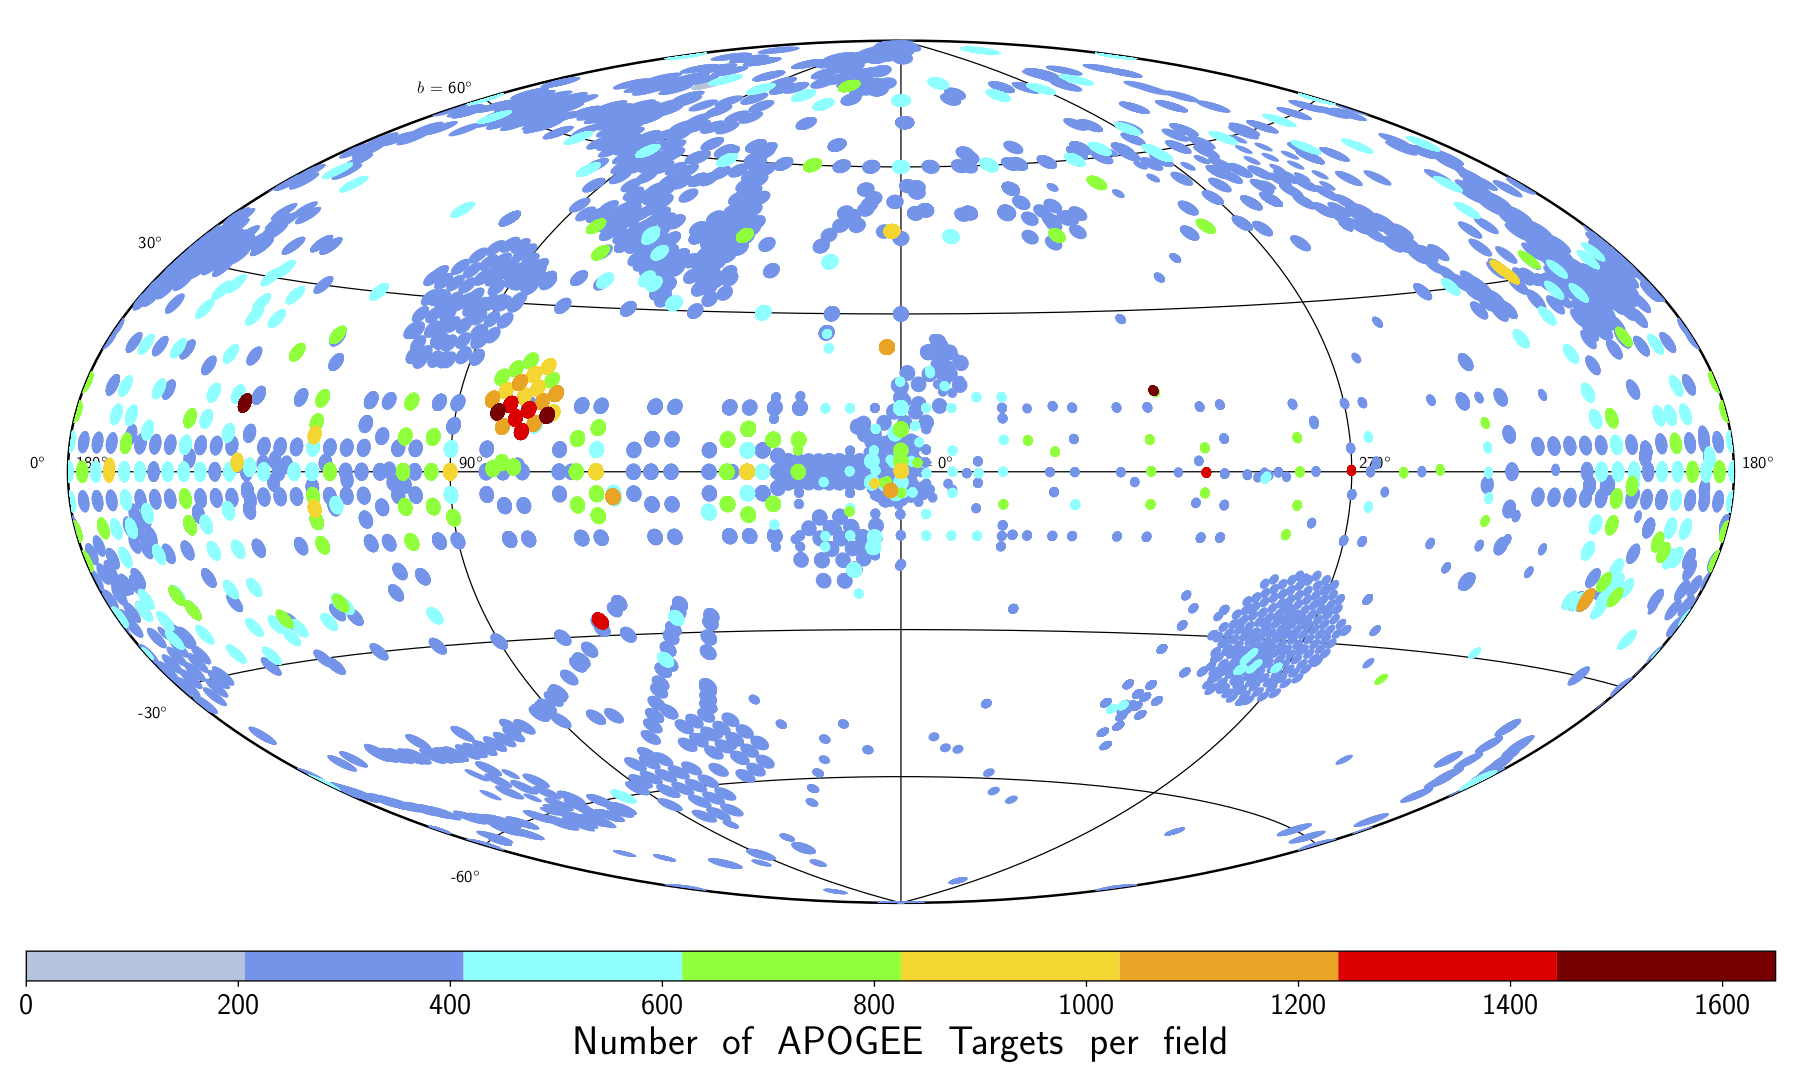
Distribution of DR17 APOGEE fields. Each field is color-coded by the number of targets in that field in DR17.
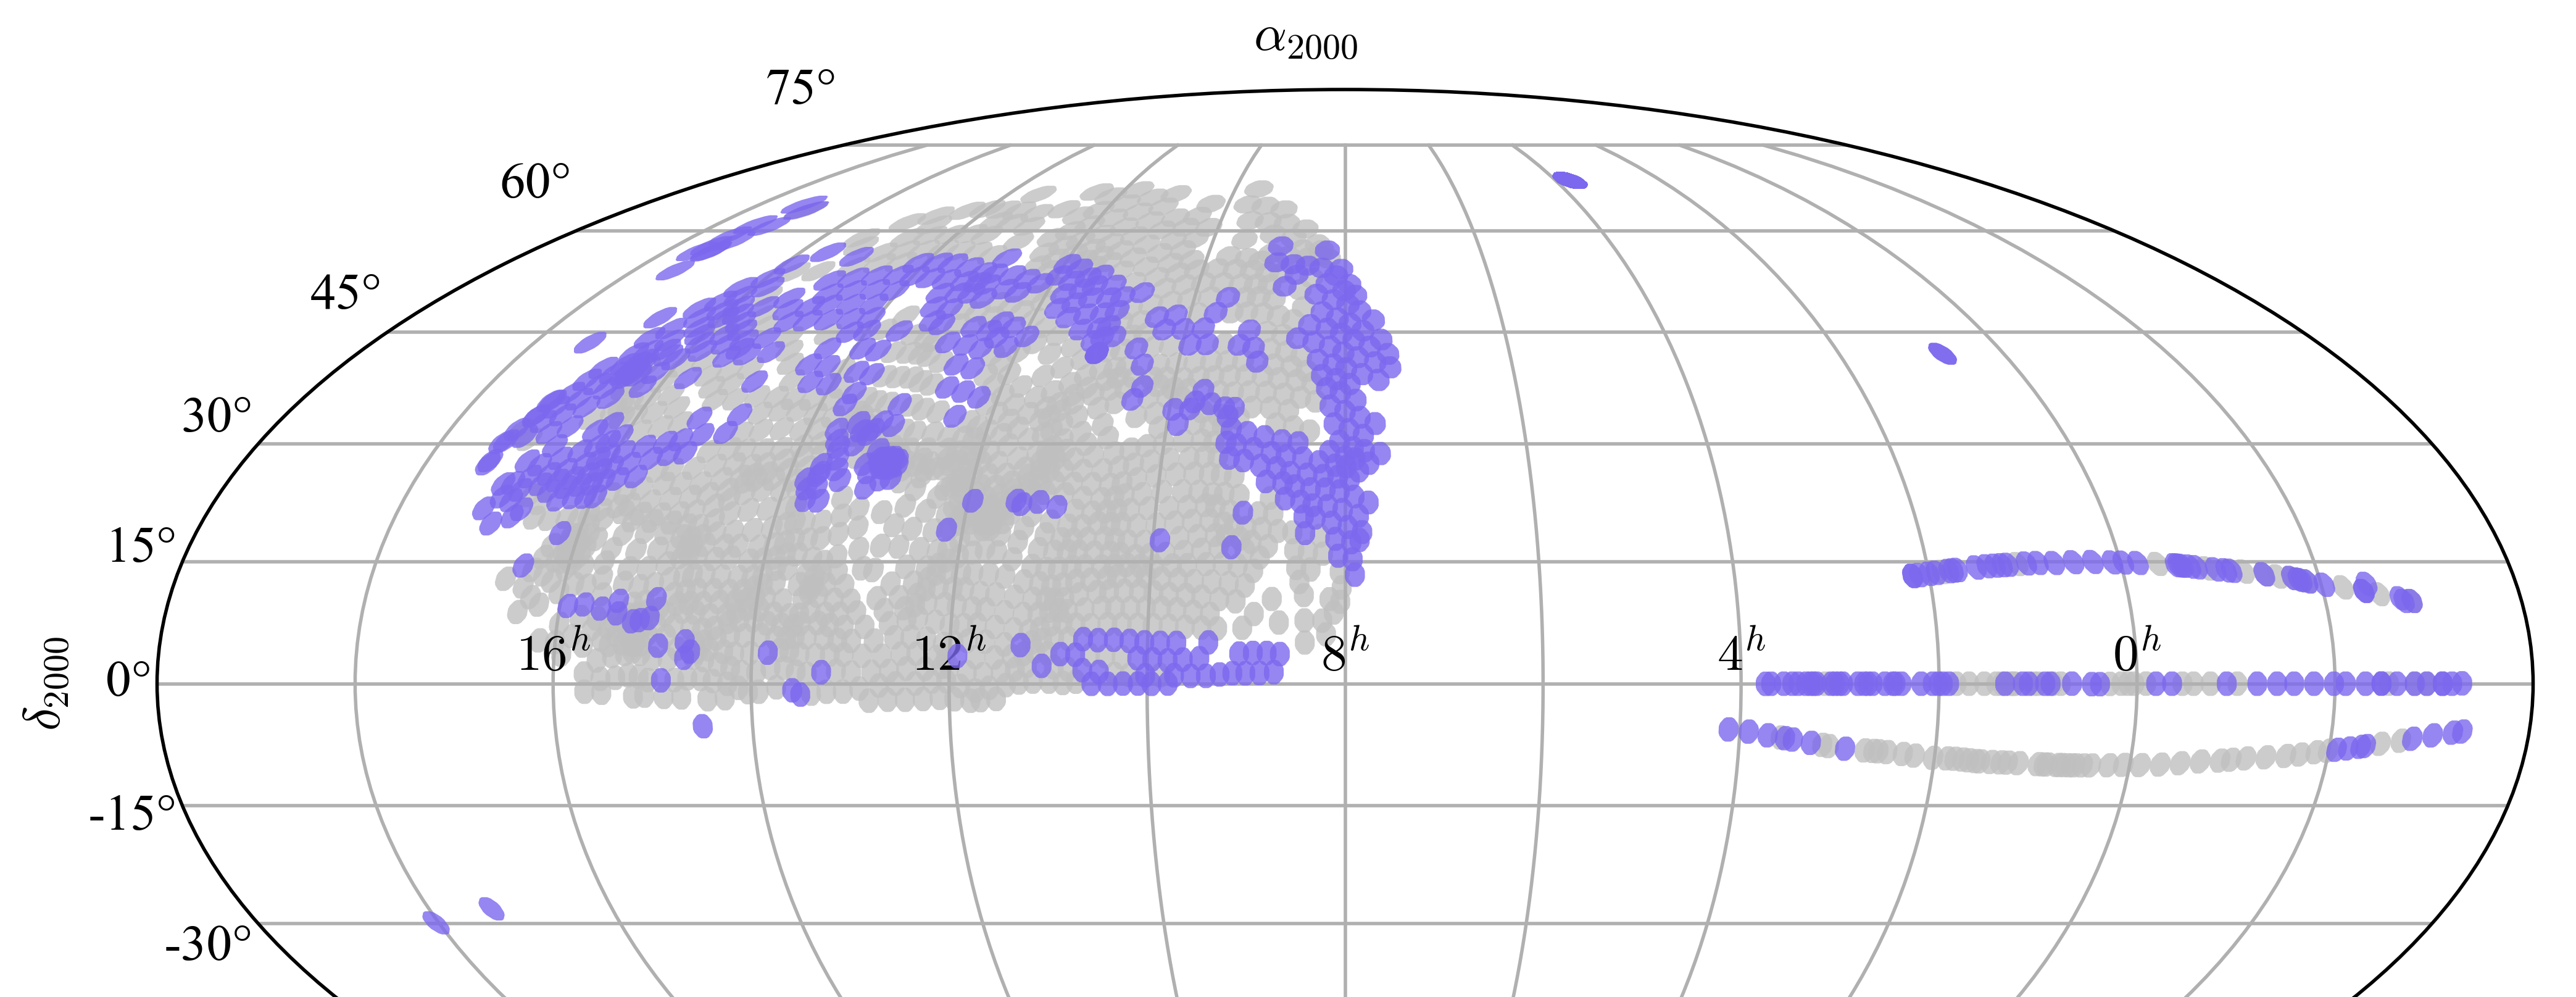
DR17 MaNGA spectroscopic coverage in Equatorial coordinates. Grey shows potential fields (tiles), while blue shows the observed plates included in DR17.
With so much sky being mapped in so many different ways, questions about the size of the SDSS can be answered in many different ways. This page details the SDSS survey area and provides various ways to count the data of Data Release 17.
Imaging statistics
- Total unique area covered
- 14,555 square degrees
- Total area of imaging (including overlaps)
- 31,637 square degrees (excluding supernova runs)
- Individual image field size
- 1361x2048 pixels (0.0337 square degrees)
- Number of individual fields
- 938,046 (excluding supernova runs)
- Number of catalog objects
- 1,231,051,050
- Number of unique detections
- 932,891,133
- Median PSF FWHM, r-band
- 1.3 arcsec
- Pixel scale
- 0.396 arcsec
- Exposure time per band
- 53.9 sec
- Time difference between observations of each band
- 71.72 sec (in riuzg order)
- Global astrometric precision
- 0.1 arcsec rms (absolute)
Number of unique, primary sources
- Total
- 469,053,874
- Stars
- 260,562,744
- Galaxies
- 208,478,448
- Unknown
- 12,682
Effective wavelengths & magnitude limits
(95% completeness for point sources)
(95% completeness for point sources)
- u
- 3551Å
22.0 - g
- 4686Å
22.2 - r
- 6165Å
22.2 - i
- 7481Å
21.3 - z
- 8931Å
20.5
- u
- 1.3%
- g
- 0.8%
- r
- 0.8%
- i
- 0.7%
- z
- 0.8%
Optical spectroscopy data statistics
All programs combined
- Total spectra
- 5,789,200
- Useful spectra
- 4,846,156
- Galaxies
- 2,863,635
- Quasars
- 960,678
- Stars
- 1,021,843
- Sky
- 475,531
- Standards
- 108,603
- Unknown
- 352,320
Stellar (SEGUE)
- Effective area (deg2)
- 1,317
- Plates
- 229
- Total spectra
- 155,520
- Unique objects
- 138,099
Exoplanets (MARVELS)
- Targets
- 11,040
Extragalactic (BOSS/eBOSS)
| Statistic | Total | Unique |
|---|---|---|
| Spectroscopic effective area (deg2) | ... | 9,376 |
| Plates | 3,946 | 3,803 |
| Spectra | 3,946,000 | 3,518,265 |
| All Galaxies | 1,913,705 | 1,775,300 |
| CMASS | 980,922 | 904,686 |
| LOWZ | 374,913 | 349,071 |
| eBOSS LRG | 298,762 | 279,304 |
| eBOSS ELG | 269,889 | 252,308 |
| All Quasars | 1,032,126 | 919,221 |
| BOSS | 447,204 | 386,728 |
| eBOSS | 584,922 | 532,493 |
| Stars | 428,828 | 385,800 |
| Standard stars | 83,345 | 65,247 |
| Sky | 365,243 | 330,731 |
| Unclassified spectra | 410,338 | 361,383 |
IFU spectroscopy (MaNGA)
- Total galaxies (high quality cubes)
- 10,145
- Unique galaxies
- 10,010
- Plate scale
- 7 deg2
- IFUs per plate
- 17
- Wavelength
- 3600-10,000 Å
MaNGA Stellar Library (MaStar)
- Total high-quality spectra
- 59,266
- Unique stars (high quality)
- 24,130
- Plate scale
- 7 deg2
- IFUs per plate
- 17
- Wavelength
- 3600-10,000 Å
Infrared (APOGEE) spectroscopic data statistics
- Main Red Star sample
- 372,458
- AllStar Entries
- 733,901
- APOGEE-2S Main Red Star Sample
- 96,547
- APOGEE-2S AllStar Entries
- 204,193
- APOGEE-2S Contributed AllStar Entries
- 92,152
- NMSU 1-meter AllStar Entries
- 1,175
- Telluric AllStar Entries
- 45,803

