
How do I use the MaNGA Catalog DAPALL File?
The DAPALL file
The DAPALL file is a summary file from the MaNGA Data Analysis Pipeline (DAP). It provides data collated from the headers of the output DAP MAPS and model LOGCUBE files (see the MaNGA Data Model) and global metrics derived from the DAP analysis products. Further information can be found here.
Accessing the DAPALL file with Python
Astropy primer for working with table data
First open the file and select those entries with successful analysis from the DAP using the HYB10-MILESHC-MASTARSSP method.
import numpy as np
from astropy.io import fits

dapall = fits.open('dapall-v3_1_1-3.1.0.fits')['HYB10-MILESHC-MASTARSSP'].data
indx = dapall['DAPDONE'] == 1
tbdata = dapall[indx]
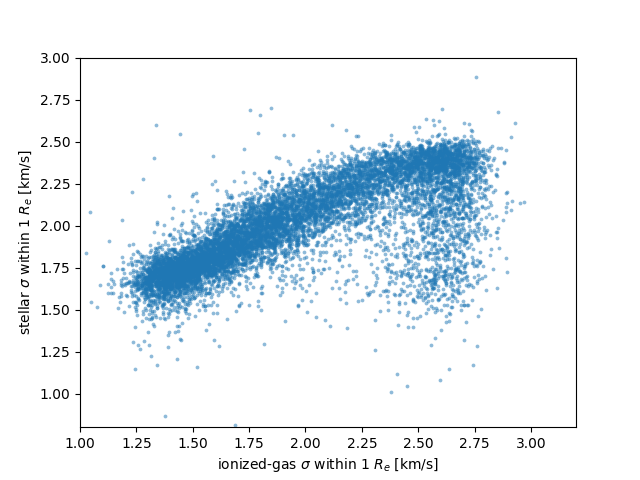
We can use this file to make a simple plot of stellar vs. gas velocity dispersion within the effective radius, for example:
import matplotlib.pyplot as plt
plt.scatter(np.ma.log10(tbdata['ha_gsigma_1re']),
               np.ma.log10(tbdata['stellar_sigma_1re']),
               alpha=0.5, marker='.', s=30, lw=0)
plt.xlim(1,3.2)
plt.ylim(0.8,3)
plt.xlabel(r'ionized-gas $\sigma$ within 1 $R_e$ [km/s]')
plt.ylabel(r'stellar $\sigma$ within 1 $R_e$ [km/s]')
plt.show()
Accessing the DAPALL file with IDL
The DAPALL file can be read in using, for example, MRDFITS. This will put the data into an IDL structure.
t=mrdfits('dapall-v3_1_1-3.1.0.fits',3,hdr)
; Print column names
help,t,/str
; Select the successful HYB10-MILESHC-MASTARSSP analysis products
indx = where(t.dapdone eq 'T')
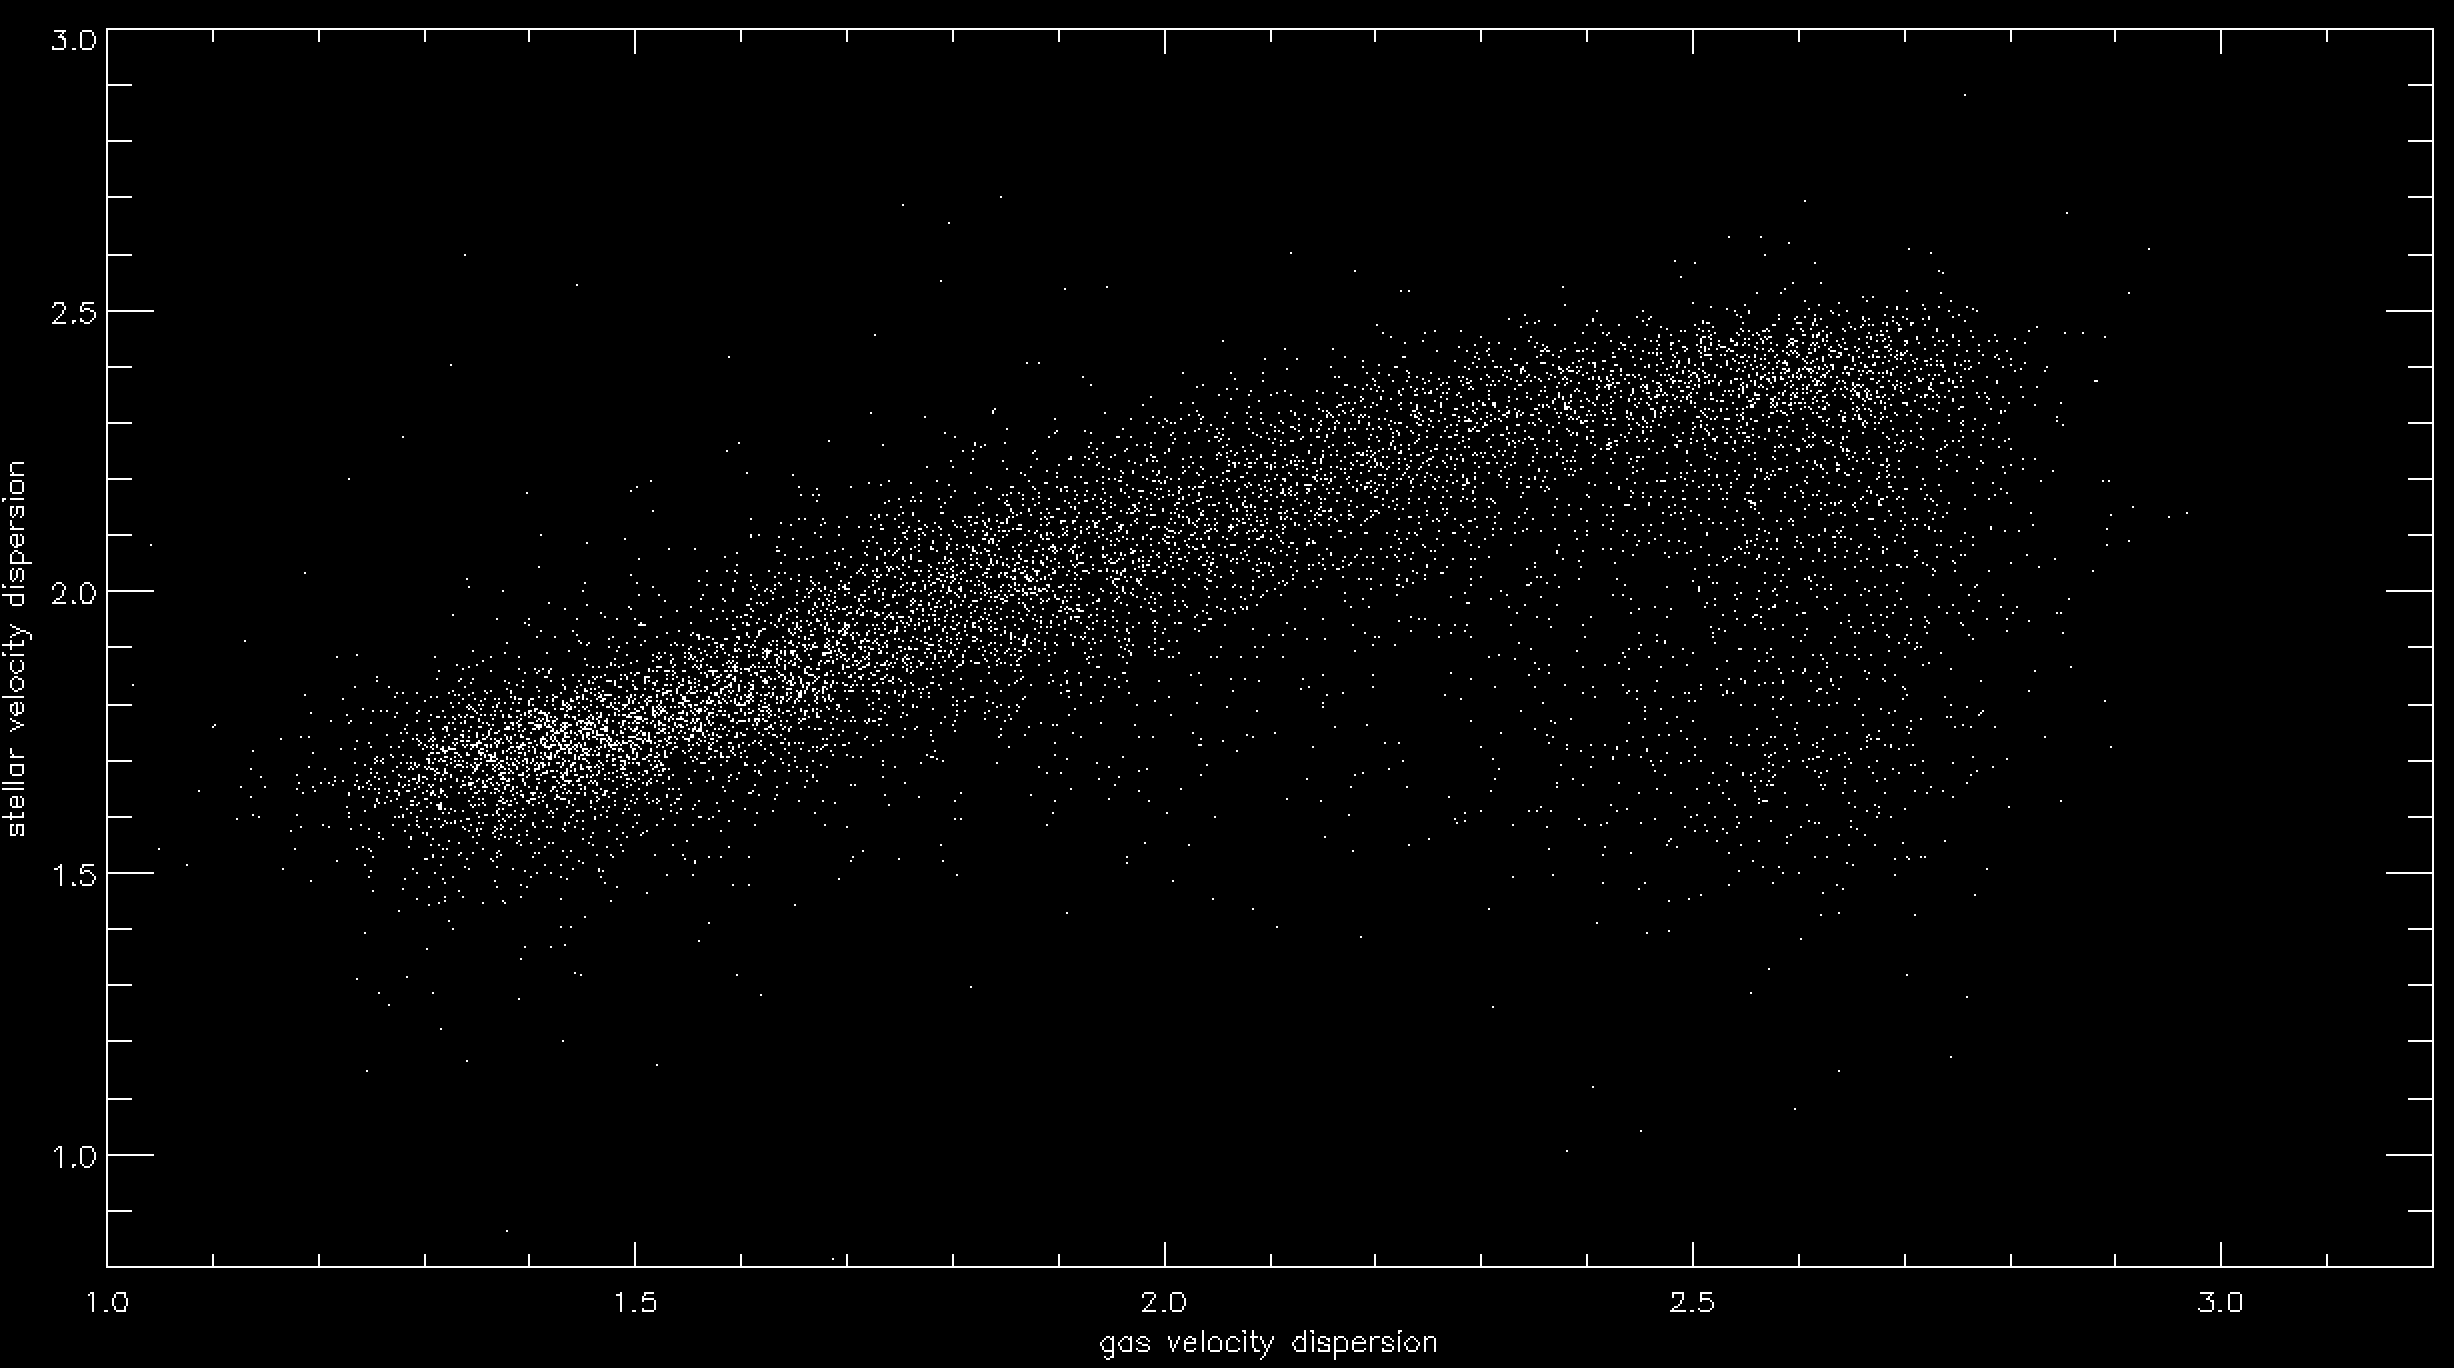
We can use this file to make a simple plot of stellar vs. gas velocity dispersion within the effective radius, for example:
gas=alog10(t.ha_gsigma_1re[indx])
stars=alog10(t.stellar_sigma_1re[indx])
xt='gas velocity dispersion'
yt='stellar velocity dispersion'
plot,gas,stars,psym=3,xrange=[1,3.2], yrange=[0.8,3.0],xtitle=xt,ytitle=yt,charsize=1.5/ysty,/xsty
;might take a bit of time to plot (lots of data points!)
Accessing the DAPALL file with Marvin
Accessing DAPALL file using query
The DAPall file can be accessed using Marvin query tools. First, we select the stellar and gas velocity dispersion within the effective radius as properties of the datamodel.
from marvin.utils.datamodel.query import datamodel

qdm = datamodel['DR17']
dapall = qdm.groups['DAPall Summary']
dapall.ha_gsigma_1re, dapall.stellar_sigma_1re
Now we can use those properties to query the MaNGA sample. Let's select MaNGA galaxies with redshift z < 0.1 and the HYB10 bintype, so we only search in one model LOGCUBE to avoid duplicated results:
from marvin.tools.query import doQuery

myparams = dapall.list_params('full', subset=['ha_gsigma_1re','stellar_sigma_1re'])
q, r = doQuery(search_filter='nsa.z < 0.1 and bintype.name==HYB10', return_params=myparams)
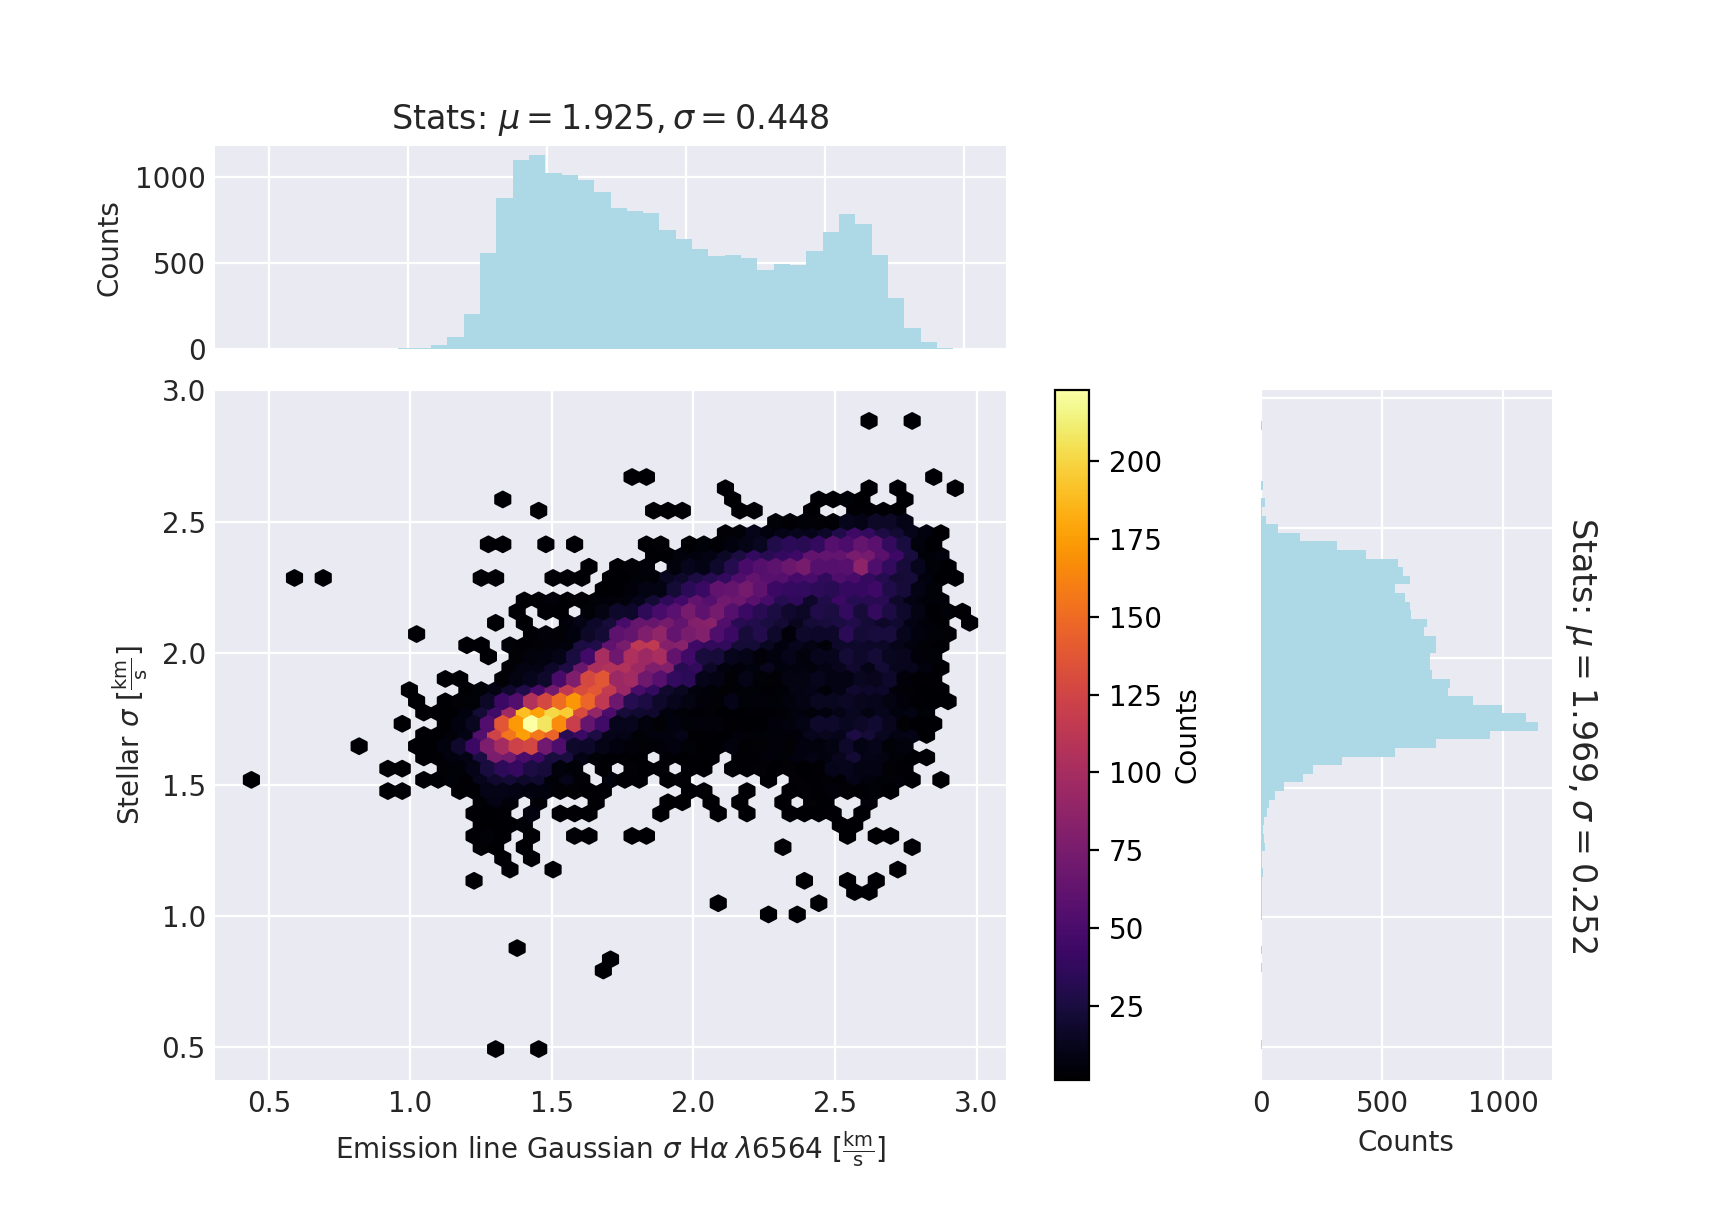
And make a scatter plot of the results using the dapall datamodel for the labels:
from marvin.utils.plot.scatter import plot

x = np.ma.log10(r.getListOf('ha_gsigma_1re', return_all=True))
y = np.ma.log10(r.getListOf('stellar_sigma_1re', return_all=True))

from marvin.utils.datamodel.dap import datamodel
dm = datamodel['DR17']
prop1 = dm['emline_gsigma_ha']
prop2 = dm['stellar_sigma']

plot(x,y,xlabel=prop1,ylabel=prop2)
Accessing DAPALL parameters for individual galaxies
Additionally, the DAPall parameters can be accessed from Maps and ModelCube objects via the dapall attribute. For example, for the MaNGA object (plate-ifu) 7443-12703:
from marvin.tools.maps import Maps
my_map = Maps('7443-12703')
my_map.dapall
For more examples see the Marvin documentation.
Accessing the DAPALL file with CAS
The DAPALL file exists as a table in CAS. You can query the DAPALL table under the Query tab in CASjobs. For example, to find all galaxies with a star-formation rate within one effective radii > 5 solar masses per year:
SELECT
mangaid, objra, objdec, daptype, z, sfr_1re
FROM dbo.mangaDapAll
where sfr_1re > 5 and daptype = 'HYB10-MILESHC-MASTARSSP'

