
Selection Biases
Here we discuss the selection biases present in APOGEE data and provide references. APOGEE spectra are not taken from a random set of all possible stars in a field. As a result, APOGEE observations are not representative of the true underlying stellar population until several selection biases are accounted for.
Targeting Procedure
Recovering the selection biases for APOGEE first depends on understanding how stars were selected as targets for the survey. A detailed description of the selection process is presented on the Targeting Information page and citations therein, but a low-level summary is provided here for convenience.
Stars selected for observation in APOGEE were not all chosen randomly. Many stars in APOGEE were targeted with specific science motivations in mind, including (but not limited to) members of star clusters, the Magellanic clouds, stellar streams, photometrically variable stars, or standard calibration stars. Targets selected specifically are considered Special Targets. Stars chosen for specific reasons like this represent a significant selection bias and are effectively over-represented in the full APOGEE sample compared to their true prevalence in the Galaxy. Selection biases can only be reliably calculated for the sample of stars that were targeted on a truly random basis.
The stars that were targeted randomly are commonly referred to as the Main Red Star Sample. This sample was designed to target giant-type stars based on their photometric (J-KS)0 color and H-band apparent magnitude (mH). During the targeting process, the 2MASS photometric catalog is adopted as the list of all potential targets for a given area of the sky. The potential targets are separated into three cohorts (short, medium, or long) based on their H-band apparent magnitude. The short cohort contains the brightest stars which require the fewest observations; the long cohort contains the faintest stars that require the most visits. Targets in the Main Red Star Sample are randomly selected from each cohort, for every field. The exact color-magnitude limits which define a cohort can differ on a plate-by-plate basis and vary for different components of the Galaxy (i.e., disk, halo, bulge). Please see the Targeting Information page for more detail (Programs in the Main Red Star Sample).
Selecting the Random Sample
EXTRATARG bitmask in the allStar file. If no bits are set in EXTRATARG (i.e., EXTRATARG==0), that target meets the criteria for the Main Red Star Sample for its sky location (disk, bulge, or halo).
Note that this tag was created for convenience and is not a fundamental targeting flag. For a more detailed breakdown into the selection function used for a target, see Targeting Information and the Targeting Bitmasks.
Targeting & Selection Related Vocabulary
- Main Red Star Sample
- The sample of red giant stars that were targeted for APOGEE at random from the 2MASS NIR photometric catalog (also uses
Spitzer or WISE MIR catalogs to deredden the NIR color). This subset is sometimes also called the “main survey sample” in reference to APOGEE-1, but due to the expansion of "main survey" goals in APOGEE-2 we have generalized the term. Targets from the Main Red Star Sample can be easily identified using theEXTRATARGbitmask in various data products. - Cohort
- Bins in apparent H-band magnitude, defined for targeting purposes. A star can belong to the “short”, “medium”, or “long” cohort, which are defined by apparent magnitude limits on a plate-by-plate basis. Stars belonging to the “short” cohort are brighter and require fewer visits than the fainter stars in the “long” cohort.
- Selection Fraction
- The ratio of the number of stars observed in APOGEE compared to total number of possible targets from the 2MASS NIR photometric catalog; a measure of the survey completeness. Determined independently for different sky positions (organized by APOGEE fields) and in individual bins of magnitude (cohorts) and color.
- Raw Selection Function
- The selection fraction as a function of sky position (APOGEE field), photometric (J-KS)0 color, and H-band apparent magnitude (mH). Calculated directly from APOGEE data products.
- Effective Selection Function
- The selection fraction as a function of sky position and distance. The Raw Selection Function can be converted into an Effective Selection Function by using a 3-dimensional dust map and some assumptions on the absolute color-magnitude distribution of the sampled population (i.e., from stellar evolution theory or isochrones).
Selection Function
The key to quantifying the selection biases in APOGEE lies in the selection function. A selection function is defined as the fraction of stars observed compared to the intrinsic number of stars present in a field, often as a function of sky position, color, magnitude, or distance. The selection function is calculated using the Main Red Star Sample only. The Selection Fraction is a measurement of how complete the survey is in that region of the sky; how underrepresented an observed star is compared to the intrinsic underlying stellar population in the field.
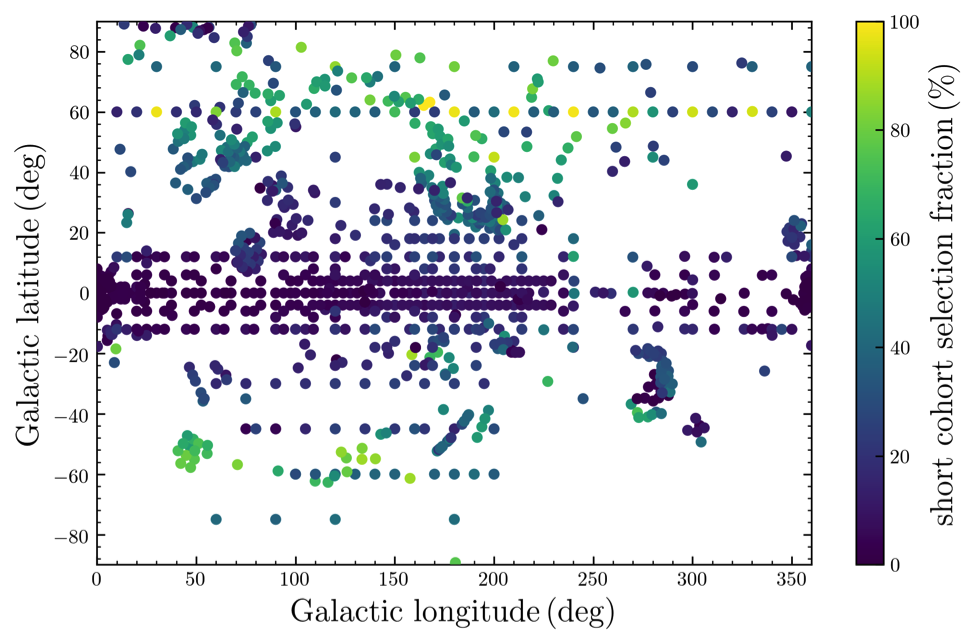
For example, an APOGEE field pointing towards the Galactic disk is expected to have a lower selection fraction, as APOGEE can only observe a small number of stars in a densely populated region. In the Galactic Halo, where stellar number density is lower, APOGEE can observe a much higher fraction of the total stars in the field. Similarly, stars in the short cohort with a lower H-band apparent magnitude (brighter) are likely to be represented by a higher selection fraction than fainter stars.
The selection function is calculated independently for every cohort and color combination in every field. For each field/cohort combination, the selection fraction is the number of stars in the spectroscopic sample (observed in APOGEE) divided by the number of stars in the photometric sample (from the 2MASS point source catalog). The number of stars observed in the Main Red Star Sample for every field/cohort combination can be recovered from the allStar file. The list of possible targets from 2MASS is stored in the apogee2Object data products for every field. More information about the contents of these files and their respective data models is available on the DR17 Data Access.
The Selection Function can be defined in several different ways; the Raw Selection Function, calculated from the data directly as described above, is the selection fraction as a function of sky position (APOGEE field), photometric (J-KS)0 color, and H-band apparent magnitude (cohort). A related quantity, the Effective Selection Function, is the selection fraction as a function of sky position and distance, and is more useful for many applications in astronomy. The Raw Selection Function can be converted into the Effective Selection Function by using a 3-dimensional dust map, and some assumptions on the absolute color-magnitude distribution of the sampled population (i.e., from stellar evolution theory or isochrones).
Further Reading
Papers
- J. Imig et al. (in preparation)
- Selection function for DR17
- Mackereth et al. 2020
- Weighing the stellar constituents of the galactic halo with APOGEE red giant stars
- Nandakumar et al. 2017
- Effects of the selection function on the metallicity trends in spectroscopic surveys of the Milky Way
- Bovy et al. 2016a
- On Galactic Density Modeling in the Presence of Dust Extinction Way
- Bovy et al. 2016b
- The Stellar Population Structure of the Galactic Disk
Code
- https://github.com/jobovy/apogee
- Python tools for evaluating the APOGEE Selection Function

