
SEGUE Tutorial
Survey Design
Both SEGUE-1 and SEGUE-2 used the 2.5m Sloan Foundation Telescope (Gunn et al. 2006) and the two original Sloan Digital Sky Survey fiber spectrographs (Smee et al. 2013). For a SEGUE line-of-sight, each of these two spectrographs acquired data for 320 of the 640 fibers over the 7 square degree field. The fibers were plugged into aluminum plates mounted in the telescope focal plane, with each set of 640 spectra in a single 7 square degree field referred to as a "plate." The spectrograph resolution was 2Å at 5000Å. SEGUE was a magnitude-limited survey; the spectra on each plate were integrated to a target S/N at a fiducial magnitude.
For each line of sight, SEGUE identified spectroscopic targets using SDSS photometry and astrometry for fiber assignment (see SEGUE Target Selection). A number of fibers were also devoted to calibration.
SEGUE-1 ran from Winter 2004-2008. With 413 unique plates (and 29 repeated plates), the spectroscopic component covered 1438 square degrees of the sky, with 259,257 spectra of 228,127 unique stars, including calibration standard stars. SEGUE-2 observed from Summer 2008-2009, covering 1317 square degrees with 204 unique and 7 repeated plates. This survey obtained 128,288 spectra of 118,958 unique stars. The different plates and programs in the SEGUE survey are available on the SEGUE Plates page.
Differences between SEGUE-1 and SEGUE-2
Spatial Coverage
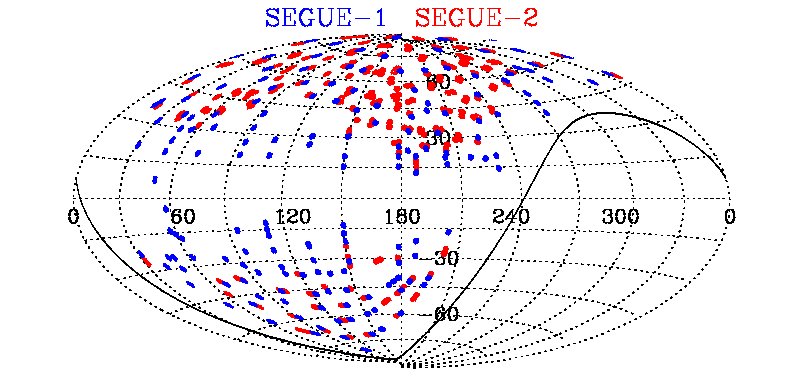
SEGUE-1 plates were placed to probe all of the major known Galactic structures (disk, halo, streams) with the exception of the bulge. In contrast, the SEGUE-2 survey focused on stars in situ in the Milky Way halo. For more information about the motivation of the two surveys, see the SEGUE overview page.
Nearly all of the SEGUE-1 lines of sight are studied with two plates, one bright (segue, 14.0<r0<17.8) and one faint (seguefaint, r0>17.8). SEGUE-2 devotes only one plate to each line of sight. The plates for each SEGUE program, and their RA, Dec, etc., are listed on the SEGUE Plates page.
Target Selection
SEGUE-1 sought to characterize the large-scale stellar structures in the Galaxy. In addition, it sought samples of rare objects, such as stars with unusually low metallicity. The variety of science goals dictated a target-selection algorithm that sampled stars at a variety of distances. SEGUE-1 targets 15 different types of stars at a variety of colors and apparent magnitudes to probe distances from 10 pc (with WDs and M and K dwarfs) to the outer halo at d ~ 100 kpc (with BHB and red K giant stars).
In contrast, SEGUE-2 focuses on in situ stars in the distant halo. As SEGUE is a magnitude-limited survey, this goal requires observing stars more intrinsically luminous than the main sequence. SEGUE-2 samples 9 different target categories.
The photometric and astrometric sample used to select spectroscopic targets differs for the two surveys. SEGUE-1 relies on photometry from a series of SEGUE imaging stripes (see Yanny et al. 2009 for more detail), processed in the same manner as SDSS photometry, in conjunction with proper motions from various astrometric catalogs (Munn et al. 2004, Lepine 2008). SEGUE-2 selects targets using SDSS DR7, from ugriz photometry (Abazajian et al. 2009) and proper motions from the USNOB catalog, recalibrated for SDSS (Munn et al. 2004).
Except for the specific target selection used for the two surveys, the data from SEGUE-1 and SEGUE-2 are otherwise very similar. Combining data from the two surveys in an analysis is no different than combining the different spectroscopic target types from an individual survey.
SEGUE Data
Data Processing
Each spectroscopic observation was extracted and reduced with the SDSS spectroscopic pipeline. These stellar spectra range from 3850 to 9200Å in vacuum wavelengths.
Along with spectroscopic data, SEGUE utilizes photometry from SDSS. Information about the reduction of these data is available on the Imaging Pipeline page. As part of this pipeline, each photometric object is classified as either a star or galaxy. Additionally, each individual spectra is position-matched in RA and Dec with the photometric catalog.
SEGUE Stellar Parameter Pipeline (SSPP)
After the SDSS spectroscopic pipeline has reduced and calibrated the SEGUE and SDSS Legacy stellar spectra, each one is processed by the SEGUE Stellar Parameter Pipeline, which provides estimates of Teff, log g, and [Fe/H] for most stars with Teff between 4000 and 10,000 K and S/N greater than 10. The SSPP also measures the line indices of various atomic and molecular lines. This pipeline has been improved considerably since DR8. In addition, the SSPP now determines the [α/Fe] abundance to 0.1 dex for stars with Teff between 4500 and 7500 K, log g between 1.5 and 5.0, [Fe/H] between -1.4 and +0.3, and S/N greater than 20. These will be in a forthcoming [α/Fe] value-added catalog.
SEGUE Value-Added Catalogs
DR9 provided two more value-added catalogs, which are unchanged as of DR12. First, Duplicate Spectra provides a list of all of the repeat spectroscopic observations of a single photometric target. Second, DR9 provides various weights for SEGUE G- and K-dwarf stars, to account for observational biases. This value-added catalog explains some of the different observational biases in the SEGUE sample and provides guidance on correcting for them to achieve a complete, unbiased sample.
Extracting Different Types of SEGUE Data
There are two main types of data product from SEGUE: the spectra and the observed and estimated stellar properties, such as ugriz photometry, proper motions, and estimated stellar parameters. There are a range of different options to access this data. Experts can directly access the DR15 data files. Below we briefly summarize some of the best ways to extract information from SEGUE for beginners.
Extracting SEGUE spectra
Each individual spectroscopic observation is identified by the plate it was observed on, the MJD the observation occurred on, and the fiber number it was assigned to, called the fiberid. In addition, each spectrum has a unique identifier, called specobjid. For an overview of the available spectroscopic information, please use the SDSS Spectroscopic Data and Getting the Data pages.
The SEGUE and stellar spectra for DR9 and later are organized into three pipeline runs, distinguished by the RUN2D: RUN2D=26 contains plates from the SDSS Legacy survey and SEGUE-1 (plates 182 through 2974), whereas RUN2D=103 contains a few special cluster plates, and RUN2D=104 contains SEGUE-2 plates (generally plate number > 3000).
If you want a quick look at the spectra for one or more targets, use the Science Archive Server (SAS) Optical Spectrum Search, remembering to check off RUN2Ds 26, 103, 104. There is a bitmask tab allowing you to limit the search results, or you can get enter specific values of the plate, MJD, and fiberid. Upon a search, you can examine the observed spectra, best fit spectra, basic information about the target (RA, Dec, ugriz information). You also have the option of downloading the spectra (FITS) files by using the Download (rsync) or Download (wget) buttons or clicking the single-file download.
Finally, one can also access the spectroscopic data on-line with the RUN2D and plate information. Experts should feel free to jump to the Data Model for SDSS. Rerun 103 reexamined the cluster plates to improve flux calibration. Due to crowded fields or a lack of photometry when the plate was designed, the list of stars used by the SDSS pipeline for flux calibration needed to be edited by hand for these plates. Note that for all of the RUN2Ds the actual spectroscopic pipeline was unchanged in any way that would affect the science.
If you know which RUN2D your plate is in, you may go to the SAS archive for that plate by pointing your browser here, and selecting the appropriate RUN2D (26,103, or 104) and PLATE. Each spPlate-$PLATE-$MJD.fits file in this directory contains the 640 spectra associated with that individual plate. Alternatively, you can use rsync and wget to do a Bulk Data Download. More information is available in the section on Downloading the Data.
Extracting SDSS Images of SEGUE Stars
There are various tools available to extract SDSS images for SEGUE targets. You can create a Finding Chart, or extract images for up to 1000 objects using the Image List Tool. If your needs are more complex than this, please use the Imaging Data.
Extracting Stellar Properties from SEGUE
There are a number of different data sets for SEGUE, such as the DR9 SDSS ugriz photometry and the estimated stellar parameters from the SSPP. All of this material is in the SDSS SkyServer. If you only need some basic information about a particular target, this is a good resource.
If you want extensive information for a large sample of stars, it is best to use the Catalog Archive Server (CAS). Using the SQL language, this allows you to match up data from numerous different tables for a large sample of objects. If you are new to SEGUE, SQL, and/or the CAS, we recommend using the SkyServer SQL Tutorial, Sample SQL Queries, and, most importantly, the Using SEGUE and CASJobs Tutorial.
Warnings
There are a number of issues in the SEGUE photometry and spectroscopy. Before diving into science, it is important to make sure you understand how various known problems may affect your sample. There is extensive documentation on photometric and spectroscopic caveats.
There are a number of methods you can use to ensure quality data. The SSPP provides various warning flags for its stellar parameter estimates. In addition, the SEGUE SQL Cookbook provides some basic information about making sure you retrieve high quality observations and parameters for your sample.

