
Understanding the Optical Data
In SDSS, spectra for many objects are taken simultaneously. This is possible because the spectrographs are connected by fiber optic cables to an aluminum plate in the telescope's focal plane. With this arrangement in mind, any SDSS spectrum can be identified with three numbers.
SDSS spectra were collected by a series of spectroscopic programs, described below. When analyzing spectral lines in SDSS data, remember that the SDSS wavelength scale is based on vacuum wavelengths.
- Plate
- an integer indicating which SDSS plug plate was used to collect the spectrum
- MJD
- an integer denoting the Modified Julian Date of the night when the observation was carried out. Some plates were observed more than once; these different observations will have different MJD values.
- FiberID
- an integer denoting the fiber number (1 to 640 for SDSS-I/II; 1 to 1000 for BOSS)
The Spectrographs
Previous SDSS spectroscopic data (Data Releases 1-8), including all SEGUE and SEGUE-2 data, was taken with the SDSS spectrograph. With Data Release 9, we released the first data from a new instrument: the BOSS spectrograph. We have continued to release additional BOSS spectrograph data with each new data release.
The table below gives some important information about SDSS spectra measured with both spectrographs. More information is available in The Scope of DR15: Spectroscopic data statistics.
| Feature | SDSS | BOSS |
|---|---|---|
| Fibers per plate | 640 | 1,000 |
| Fiber diameter | 3 arcsec (180 μm) | 2 arcsec (120 μm) |
| Wavelength coverage | 3800-9200 Å | 3650-10,400 Å |
| Resolution | 1500 at 3800 Å, 2500 at 9000 Å | |
| Pixel spacing | log-wavelength (10-4 dex) | |
| Units | 10-17 erg cm-2 s-1 Å-1 | |
| Wavelength calibration | < 5 km/s | |
| Wavelength reference | heliocentric vacuum wavelengths | |
Identifying SDSS spectra
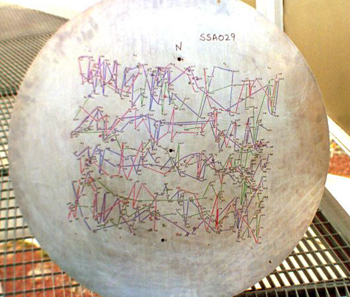
The SDSS measures many spectra in a single observation: 640 at a time with the SDSS spectrograph (used in SDSS-I, -II and in the SEGUE surveys) and 1000 with the BOSS spectrograph (used in the SDSS-III BOSS survey). The SDSS does this by means of a plate, an aluminum disk placed in the focal plane of the telescope. Each plate corresponds to a specific patch of sky, and is pre-drilled with holes corresponding to the sky positions of objects in that area, meaning that each area requires its own unique plate.
Some plates were observed in a single night; others were observed over multiple nights. Still others had intentionally repeated spectroscopic observations, with the same plate being re-observed several times. Thus, in addition to a plate number, identifying an SDSS spectrum requires knowing the MJD (modified Julian date) on which that spectrum was observed.
Each hole on each plate corresponds to one object on the sky. Optical fibers plugged into each hole bring the light from the focal plane to the pseudoslit of the spectrographs. Thus, each spectrum is also referenced by the number of the fiber (fiberID) with which it was collected. Plates used by the BOSS spectroscopic program had 1,000 fibers each; plates used by earlier SDSS spectroscopic programs had 640 fibers each. If a plate is observed on more than one MJD, the fibers will be replugged; thus a given fiberID on different MJDs will correspond to different objects on the sky.
In addition to the plate-MJD-fiberID system, SkyServer uses a unique number that encodes (64-bit hash) both plate-MJD-fiberID and the RUN2D reduction value of the spectroscopic redshift pipeline. This quantity, specObjID, is unique to each spectrum. You should use it to join tables in your SkyServer SQL queries.
Plate information
In both SAS and CAS, we provide information about each plate, including design information, observing conditions, signal-to-noise and overall quality. We discuss in more detail elsewhere the targeting criteria and data quality flags. Included in the latter is how to find which plates are "primary" observations.
Each plate has a radius of 1.49 deg. In addition, fibers cannot be placed more closely together than 55 arcsec (SDSS) or 62 arcsec (BOSS) due to the finite size of the fiber cladding. Finally, no target can be closer than 100 arcsec to the center of the plate, because of the center post on the plate.
The general design information about each plate is given by two parameters:
- SURVEY
- a string denoting the survey this plate is associated with within SDSS-III. In DR9, SURVEY is one of "sdss", "boss", "segue1" or "segue2".
- PROGRAMNAME
- a string denoting which program within a given survey this plate is associated with.
As implied in this list, spectra were collected in a series of surveys, each of which consisted of specific plate numbers. The largest survey was the SDSS Legacy Survey, which completed the original SDSS spectroscopic survey plan. Other SDSS spectroscopic surveys include the Sloan Extension for Galactic Understanding and Exploration (SEGUE) and its successor SEGUE-2, and the Baryon Oscillation Spectroscopic Survey (BOSS).
SDSS Legacy and SEGUE-1 cover plate numbers from 266 to 2974. SEGUE-2 covers plate numbers 3000 to 3509; all spectra on these plates were measured with the SDSS-I/-II spectrograph. Plate numbers 3510 or larger are BOSS plates, taken with the new BOSS spectrograph.
Each survey has a number of different programs. For the "sdss"survey plates, the most common PROGRAMNAME is "legacy", which indicates the plates used for the primary spectroscopic survey. The SDSS also had a number of special programs, especially on Stripe 82. SEGUE-1 and SEGUE-2 were broken down into a number of different programs with somewhat different targeting parameters. The primary BOSS survey PROGRAMNAME is "boss". The target selection page has links to all of the individual types of target selection, where the program names are defined.
There are also some parameters giving more detailed information, in particular CHUNK and PLATERUN. Most users can ignore these parameters; they give internal information about how exactly the plate design steps were executed.
Additional information for each plate is available, including the position of the plate on the sky, the date of observation, and other design information. A complete roster of this information can be found in the schema of the plateX table on CAS, and the plates file datamodel page.
Version numbers
Each spectrum was reduced by the SDSS Spectroscopic Pipeline. The pipeline has changed slightly over time, so it is important to track which version of the pipeline was used to reduce which spectra.
DR9 and later include two parameters to track pipeline versions:
- RUN2D
- denotes the version of extraction and redshift-finding code used
- RUNSSPP
- denotes the version of the SEGUE Stellar Parameters Pipeline (SSPP) used
For the current and previous data releases, there are many possible values of RUN2D:
- v5_10_0
- the pipeline version used for BOSS/SEQUELS/eBOSS in DR14 and DR15
- v5_9_0
- the pipeline version used for BOSS/SEQUELS in DR13
- v5_7_2
- the pipeline version used for SEQUELS in DR12
- v5_7_0
- the pipeline version used for BOSS in DR12
- v5_5_12
- the pipeline version used for BOSS in DR10
- v5_4_45
- the pipeline version used for BOSS in DR9
- 26
- the pipeline version used for the SDSS Legacy and SEGUE-1 programs
- 103
- a special version of the SDSS pipeline to handle stellar cluster plates
- 104
- the version of the pipeline run on SEGUE-2 plates
There are two possible values of RUNSSPP:
- 116
- the DR8 version of the pipeline run on all SEGUE and SDSS Legacy programs
- 122
- the DR9 version of the pipeline run on all SEGUE and SDSS Legacy programs
Fiber information
In both SAS and CAS, we provide information about each object within each plate as well. Each spectrum is labeled by its FIBERID, which for SDSS runs from 1 to 640, and from 1 to 1000 for BOSS. Note that if a plate has been observed on two different MJDs, the FIBERID in each does not necessarily correspond to the same location on the sky. The plates are plugged by human beings, and the same fiber is not necessarily plugged into the same hole each time a plate is plugged.
We discuss in more detail elsewhere the targeting criteria, the spectra themselves and catalog information, including data quality flags. Included in the latter is how to decide which spectra among repeat observations of the same object are "primary."
Finally, we distribute separate catalogs describing galaxy parameter measurements and stellar parameter measurements from the spectra.
About the Spectra
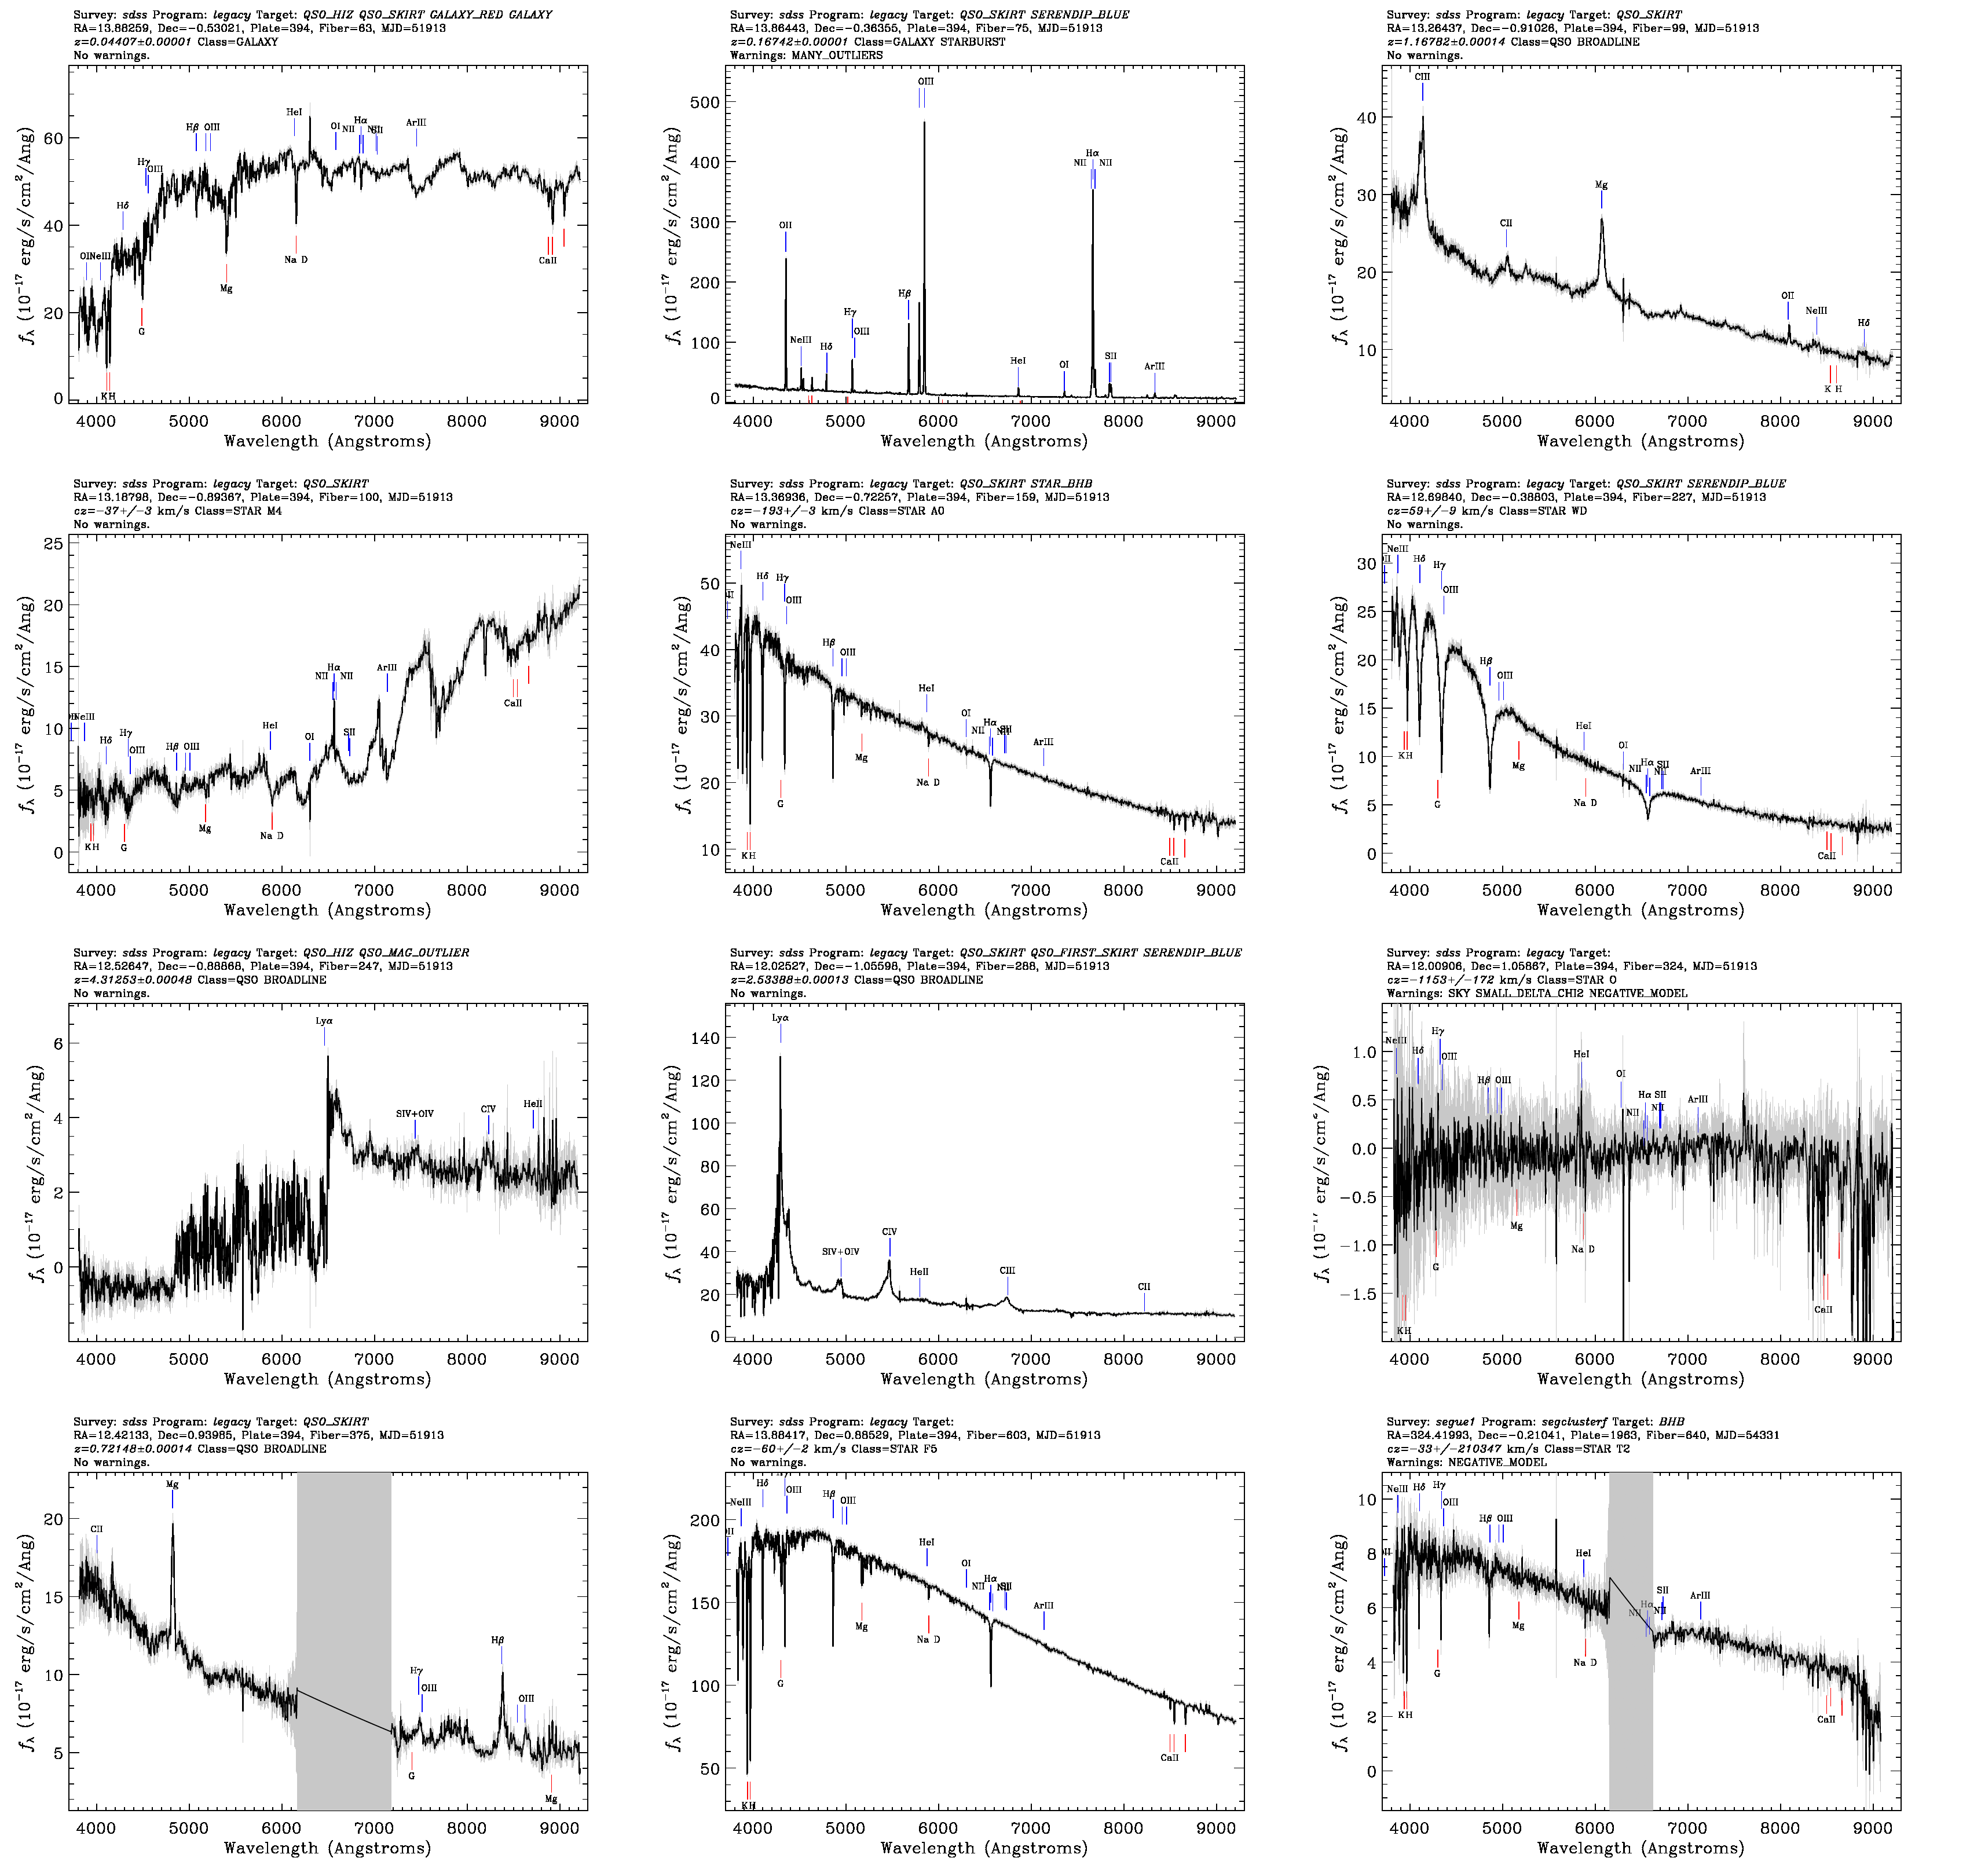
The adjacent image shows previews of 12 typical SDSS spectra. As described in the data access description, the spectra themselves are provided in spPlate files in FITS format. The primary HDU of each file contains an image which yields all 640 (SDSS) or 1000 (BOSS) spectra on each plate, each as a row in the image. These spectra are flux- and wavelength-calibrated. Additional HDUs contain the wavelength solution, variances, masks, and other information.
The logarithmic wavelength grid spacing is the same for all plates (log10 λi+1 - log10 λi = 0.0001) but the starting wavelength differs from plate to plate. All fibers on the same plate share exactly the same grid.
For more information, see the detailed descriptions of the BOSS spectrographs and the SDSS-I/-II spectrographs.
In subsequent HDU's, the spPlate files store the error and mask information. HDU1 stores the "inverse variance" of the uncertainties per pixel (i.e., one over sigma-squared). This quantity may be used, for example, in model fits to the spectra. It is set to zero for pixels that should be ignored entirely due to, e.g., bad columns (another way of thinking about it is that they have infinite error). In the spectra shown above the errors per pixel are shown as the grey band surrounding the spectrum; for masked pixels the grey band covers the full vertical extent of the figure.
The pixel mask information is stored in HDU2 and HDU3. These images yield a bitmask for each pixel, in particular the SPPIXMASK bitmask. Since the final spectrum is a combination of 3 or more individual exposures, it may be that some bits were flagged in some exposures but not in others. HDU2 is the "and mask", which lists all the bits that were set for that pixel in all exposures. HDU3 is the "or mask", which lists all the bits that were set for that pixel in any one (but not necessarily all) of the exposures. The "and mask" (HDU2) is the mask of greatest use.
Conversion between vacuum and air wavelengths
The SDSS data describing spectral line wavelengths use vacuum wavelengths. However, the wavelengths of atomic transitions are usually quoted at standard temperature and pressure (S.T.P.); this is how the CRC Handbook of Chemistry and Physics lists them for any transitions redward of 2000Ångströms.
Thus, recognizing spectral lines associated with atomic transitions may require converting the SDSS data to the equivalent values at S.T.P.
Since Data Release 9 (DR9) in 2012, the SDSS has used the following equation, based on the formulas given in Ciddor (1996), to convert from vacuum (VAC) wavelengths in Ångströms to air (AIR) wavelengths:
AIR = VAC / ( 1.0 + 5.792105E-2/(238.0185 - (1E4/VAC)^2) + 1.67917E-3/( 57.362 - (1E4/VAC)^2))
| Line | Air | Vacuum |
|---|---|---|
| H-beta | 4861.325 | 4862.683 |
| [O III] | 4958.911 | 4960.295 |
| [O III] | 5006.843 | 5008.239 |
| [N II] | 6548.05 | 6549.86 |
| H-alpha | 6562.801 | 6564.614 |
| [N II] | 6583.45 | 6585.27 |
| [S II] | 6716.44 | 6718.29 |
| [S II] | 6730.82 | 6732.68 |
Note also that the wavelengths are shifted such that measured velocities will be relative to the solar system barycentric at the mid-point of each exposure (using TAI-BEG + 0.5 * EXPTIME from the header).

