
Galaxy Properties from the Granada Group
[Back to main galaxy properties page]
Spectro-Photometric Stellar Masses
Photometric Stellar masses have been estimated by finding the best-fitting CSP templates to the observed ugriz magnitudes of BOSS galaxies, with the spectroscopic redshift determined by the BOSS pipeline. An extensive and adequate grid of templates have been generated using the publicly available Flexible Stellar Population Synthesis code (FSPS, Conroy et al. 2009). FSPS is a flexible SPS package that allows the user to compute simple and composite stellar populations for a range of IMFs and metallicities, and with a variety of assumptions regarding the average properties of the stellar population, star formation histories and dust attenuation prescriptions. The FSPS code is publicly available here.
The fit is carried out on extinction corrected model magnitudes that are scaled to the i-band c-model magnitude, i.e.:
mag_x = modelmag_x - extinction_x + (cmodelmag_i - modelmag_i),
where x denotes the photometric band (ugriz).
Below we describe our FSPS parent grid of templates, along with the 3 different configurations to which our SPS fitting procedure is applied. These configurations are obtained by imposing very simple physically plausible priors on different parameters of the parent grid. Note that these results have been so far vetted on LOWZ and CMASS galaxies. For some ancilliary targets, which span a wider range of galaxy properties, this FSPS grid might not be adequate.
Grid of templates
The FSPS parent grid comprises 1500 redshift slices within the interval 0.0 < z < 1.5. For each redshift bin (Δz=0.001), we build a set of 84,000 τ-models with varying SFH, metallicity and dust content. For each model, FSPS provides observed-frame AB magnitudes in each of the SDSS bands. Here, the spectrum is normalized so that 1 solar mass of stars is formed during the life span of the galaxy. Mass loss is taken into account.
In practice, 4 different stellar population properties are allowed for variation:
- Star formation history (SFH)
- We assume an exponentially declining SFH (τ-models) with 30 possible log-spaced values for the e-folding time, τ, within the range 0 < τ(Gyr) < 10. The SFH is assume to start at a look-back formation time tage.
- Look-back formation time (tage)
- We consider 20 different look-back formation times, tage, spanning a range 0 < tage(Gyr) < 13.7. A condition is always imposed that tage is smaller than the age of the Universe at the corresponding redshift of the galaxy, TUniverse(z), i.e. tage < TUniverse(z).
- Metallicity
- We consider 7 different values within the range -0.49 < log(Z/Zsolar ) < 0.20, where Zsolar=0.019.
- Dust attenuation
- The dust attenuation is modelled following the two-component prescription of Charlot & Fall (2000), with parameters τ1 and τ2 describing the attenuation around young and old stars, respectively. Following Charlot & Fall (2000) and Calzetti et al. (2000) , we assume τ1=3τ2 and we only consider τ2 as an independent parameter. The grid comprises 15 linearly-space values spanning a range 0 < τ2 < 0.75.
For a summary see Ahn et al. 2014.
Multiple configurations
To the above grid we impose 2 different priors on the star formation:
- earlyform
- The lifetime of the galaxy (tage) is restricted by imposing a formation time for CMASS/low-z galaxies within 2 Gyr after the Big Bang.
- wideform
- Dust is allowed but the range in the tage parameter (look-back formation time) is extended to 2 < tage (Gyr) < TUniverse(z).
For each of the 2 star formation scenarios, we consider the case of dust and nost and we assume 2 different IMFs – Kroupa and Salpeter – resulting in a total of 8 different configurations.
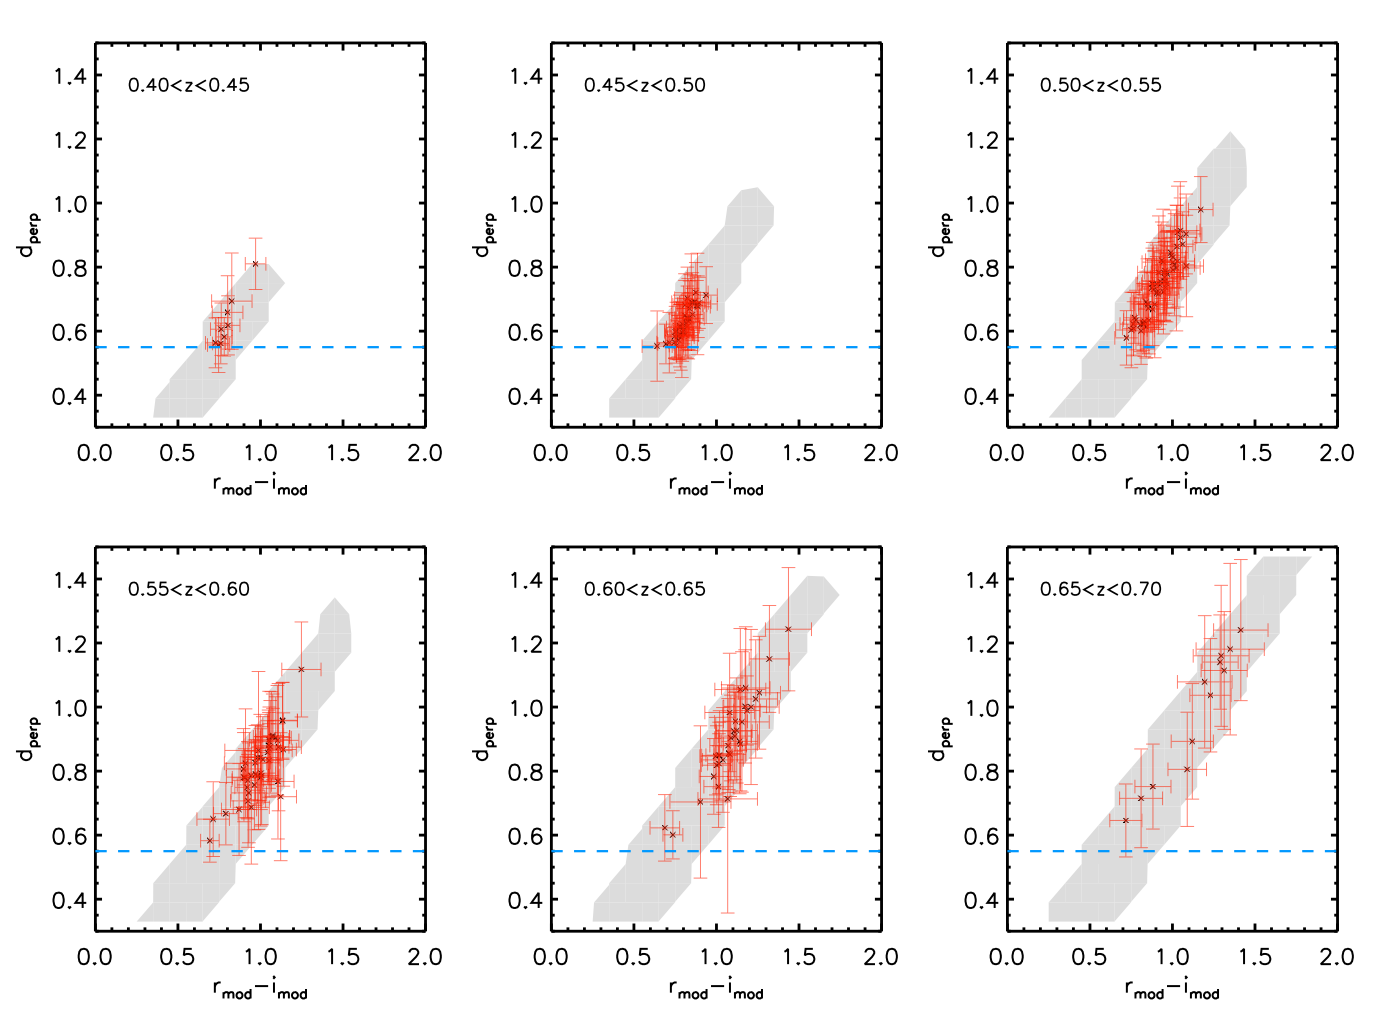
In Figure 1, we illustrate how the models (grey points) and the data (black symbols) distribute in a d⊥ vs. (r-i) diagram for 6 different redshift bins within the redshift range 0.4 < z < 0.7. The data shown consist of a randomly selected sample of 2,000 CMASS galaxies and the error bars represent the photometric errors. In each plot, the dashed line shows the d⊥ > 0.55 demarcation. The “krou_earlyform” configuration has been adopted here. Similar coverage is obtained with the rest of the configurations.
The WMAP 7 flat ΛCDM cosmology with H0 = 70, Ωm = 0.274, and ΩΛ = 0.726. (White et al. 2011) is applied universally to each of the Portsmouth-Wisconsin-Granada computations by the BOSS Pipeline.
DATA
Data Release 16 is identical to Data Release 12 and was processed under GALAXY_VERSION v1_1.
Output is browsable via Catalog Archive Server (CAS) dr15 database by selecting:
- Table stellarMassFSPSGranEarlyDust.
- Table stellarMassFSPSGranEarlyNoDust.
- Table stellarMassFSPSGranWideDust.
- Table stellarMassFSPSGranWideNoDust.
FITS output files are available from the
BOSS_GALAXY_REDUX/GALAXY_VERSION
available at the SAS URL:
https://data.sdss.org/sas/dr12/boss/spectro/redux/galaxy/v1_1.
You may download data based on the Granada FSPS datamodel from:
krou_earlyform_dust:
- granada_fsps_krou_earlyform_dust-DR12-boss.fits.gz [BOSS DR12],
- granada_fsps_krou_earlyform_dust-26.fits.gz [SDSS DR8].
krou_earlyform_nodust:
- granada_fsps_krou_earlyform_nodust-DR12-boss.fits.gz [BOSS DR12],
- granada_fsps_krou_earlyform_nodust-26.fits.gz [SDSS DR8].
krou_wideform_dust:
- granada_fsps_krou_wideform_dust-DR12-boss.fits.gz [BOSS DR12],
- granada_fsps_krou_wideform_dust-26.fits.gz [SDSS DR8].
krou_wideform_nodust:
- granada_fsps_krou_wideform_nodust-DR12-boss.fits.gz [BOSS DR12],
- granada_fsps_krou_wideform_nodust-26.fits.gz [SDSS DR8].
salp_earlyform_dust:
- granada_fsps_salp_earlyform_dust-DR12-boss.fits.gz [BOSS DR12],
- granada_fsps_salp_earlyform_dust-26.fits.gz [SDSS DR8].
salp_earlyform_nodust:
- granada_fsps_salp_earlyform_nodust-DR12-boss.fits.gz [BOSS DR12],
- granada_fsps_salp_earlyform_nodust-26.fits.gz [SDSS DR8].
salp_wideform_dust:
- granada_fsps_salp_wideform_dust-DR12-boss.fits.gz [BOSS DR12],
- granada_fsps_salp_wideform_dust-26.fits.gz [SDSS DR8].
salp_wideform_nodust:
- granada_fsps_salp_wideform_nodust-DR12-boss.fits.gz [BOSS DR12],
- granada_fsps_salp_wideform_nodust-26.fits.gz [SDSS DR8].
REFERENCES
Ahn, C. et al. 2014, ApJS, 211 ,17, doi:10.1088/0067-0049/211/2/17
Calzetti, D.; Armus, L.; Bohlin, R. C.; Kinney, A. L.; Koornneef & J. Storchi-Bergmann, T., 2000, APJ, 533, 682 doi:10.1086/308692
Conroy, C.; Gunn, J. E. & White, M., 2009, APJ, 699, 486 doi:10.1088/0004-637X/699/1/486
Charlot, S.; & Fall, S. M., 2000, APJ, 539, 718 doi:10.1086/309250
White, M.; Blanton, M.; Bolton, A.; Schlegel, D.; Tinker, J.; Berlind, A.; da Costa, L.; Kazin, E.; Lin, Y. T.; Maia, M.; McBride, C. K.; Padmanabhan, N.; Parejko, J.; Percival, W.; Prada, F.; Ramos, B.; Sheldon, E.; de Simoni, F.; Skibba, R.; Thomas, D.; Wake, D.; Zehavi, I.; Zheng, Z.; Nichol, R.; Schneider, D. P.; Strauss, M. A.; Weaver, B. A.; Weinberg, D. H. & White, M.; & 2011, APJ, 728, 126, doi:10.1088/0004-637X/728/2/126

