
eBOSS ELG target selection
Contacts
| Anand Raichoor |
|---|
| EPFL, Lausanne, Swizterland |
| anand.raichoor@epfl.ch |
| Johan Comparat |
| MPE/MPG, Munich, Germany |
| comparat@mpe.mpg.de |
Summary
ELGs are selected to cover the redshift range 0.7 < z < 1.1. The DECaLS photometry was used to draw the targets for spectroscopic observations.
The ELG selection is fully described in Raichoor et al 2017 and Comparat et al. 2016.
In DR15 we released only the targets for the SGC. Targets for the NGC and all redshifts are available in DR16 and later releases.
Description
The DECam Legacy Survey (DECaLS; co-P.I.s: A.Dey and D.J.Schlegel) is an on-going imaging survey covering 6700 deg2 of the extragalactic sky that lies in the region -20° < Dec. < +30° to depths of g=24.7, r=23.9, and z=23.0 mag (5σ point-source).
In addition, the DECaLS program also processes any public DECam observations in the DESI footprint, the largest component being the DES survey.
The DECaLS data and processing pipeline are public, with a release every six months. The footprint of the eBOSS ELG program is shown in Figure 1.
Figure 1
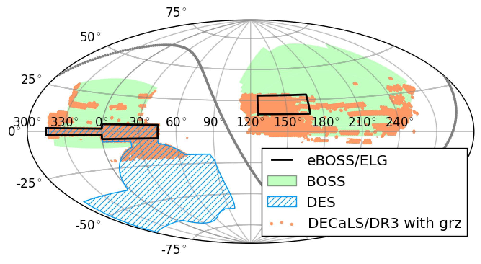
The target selection algorithm is completely described in the Table 1 below. Objects for the SGC are identified in the EBOSS_TARGET1 bitmask under bit 43, corresponding to the name ELG1_SGC. Objects for the NGC are found in the same mask under bit 44, with the name ELG1_NGC.
Table 1
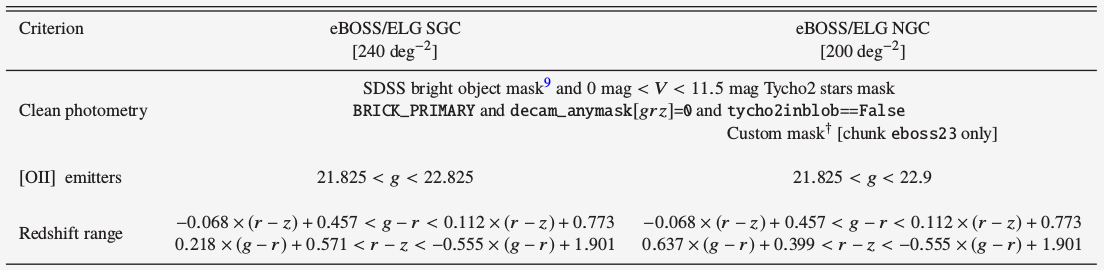
The reported densities are computed with the plate covered areas (i.e. not accounting for the masked regions).
The DECaLS catalogue quantities BRICK_PRIMARY, decam_anymask, and tycho2inblob are described on the Legacy Survey catalogs page. (This custom mask is used because of a bug in the target selection scripts, and is relevant for the chunk eboss23 only.)
Figure 2
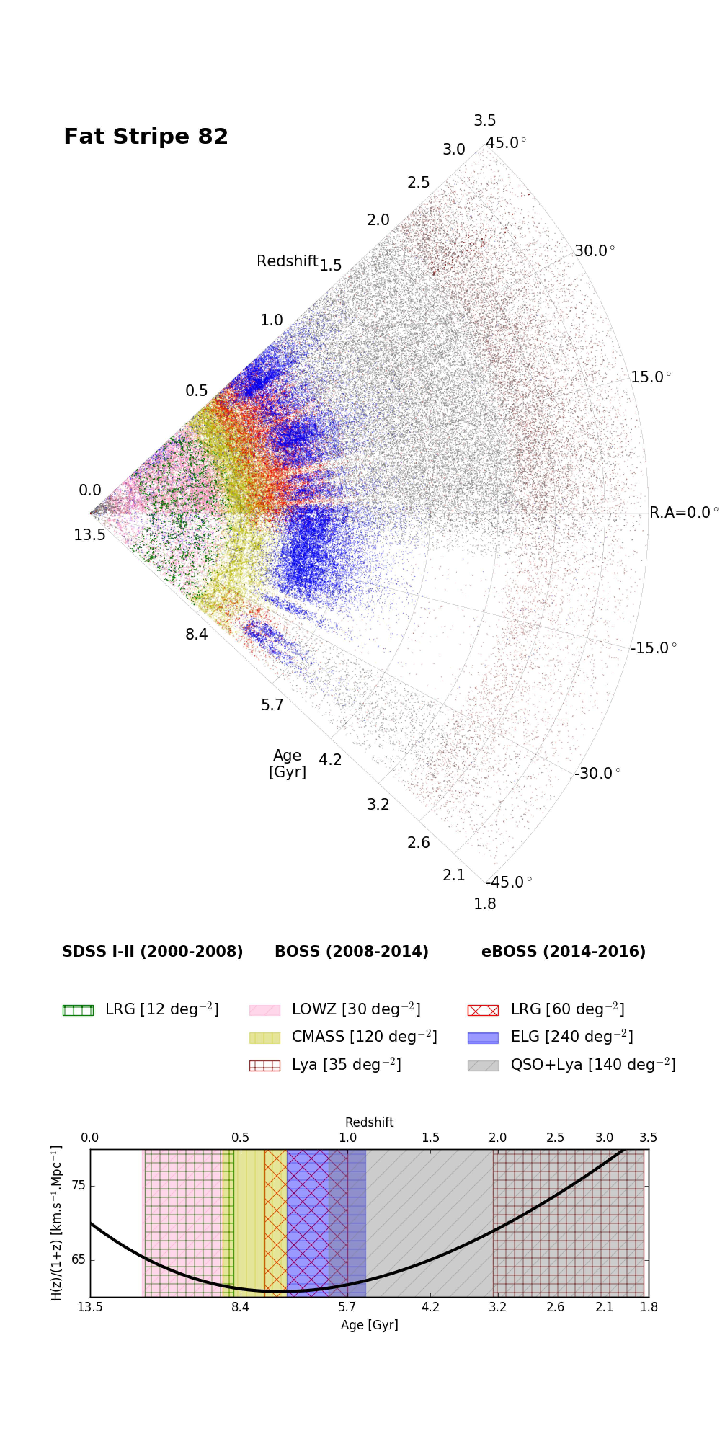
The LRG program from SDSS I-II is in green.
The LOWZ, CMASS, and Lyman-alpha programs from BOSS are in pink, yellow, and brown, respectively.
The LRG, ELG, QSO+Lyman-alpha programs from eBOSS are in red, blue, and gray, respectively; for eBOSS, we report the data observed between 2014 and 2016.
For BOSS and eBOSS, the density in the 0 < R.A.< 45 is higher than in -45 < RA < 0, because the included range in declination is higher (-5\ < Dec < 5 vs. -2\ < Dec < 2).
Top panel: sector view of observed targets.
Bottom panel: Universe rate of expansion as a function of redshift, along with the redshift range used for each tracer for the BAO measurement.
A representation of how the ELG sample is positioned compared to other cosmological samples is shown in Figure 2.
The catalogs of targets in the SGC is released as a value-added catalog within the SDSS DR14.
The software to select the ELGs from the DECaLS catalogs is available here through the svn.
The software to measure emission line and add redshift quality flags to the ELGs is available through here via the svn.
REFERENCES
ELG redshifts, Comparat et al. 2016.

