
Tiling and Geometry for BOSS and eBOSS
Overview
The fibers on the BOSS spectrograph are attached to holes drilled into metal plates. The image projected onto each plate subtends an angle of 3° diameter on the sky. Tiling is the process by which plates are positioned in a pattern that maximizes the fraction of targets that can be assigned fibers (which we define as "tiling efficiency" or "tiling completeness"), while minimizing the number of plates that are required to observe the full survey—or, equivalently, maximizing the fraction of fibers that are used for unique science targets (which we define as "fiber efficiency").
Large-scale structure, as well as galactic structure, causes inhomogeneities in the angular density of targets on the sky. Thus, a uniform distribution of tile centers will not achieve both goals of high tiling and fiber efficiency. For example, the BOSS tile distribution achieved a tiling efficiency of >93% for all BOSS targets, with a fiber efficiency of >90%. The primary reason that a target does not get assigned a fiber is fiber collisions, which we will define below. The tiling completeness of BOSS targets not involved in a fiber collision was >99%. The tiling completeness for eBOSS targets was slightly lower due to a decision to increase fiber efficiency and survey area.
Much of the philosophy behind the tiling strategy can be found in the SDSS tiling paper; Blanton et al. 2003, AJ 125, 2276.
A comprehensive tutorial of the tiling process, fiber collisions, and fiber assignment, can be found at the legacy tiling page.
Changes to tiling within BOSS
The pedagogical discussion of the general tiling process contains some information specific to the tiles used in the SDSS-I/II survey. The main BOSS changes for tiling are:
- The number of fibers per plate was increased from 640 to 1000. Of these 1000 fibers, 895 were allocated for unique science targets, although they are not always a sufficient number of science targets to fill the allocation. At least 100 fibers were allocated to standard stars and sky, and a large fraction of unassigned fibers were given to supplement the sample of sky spectra. The last five fibers were required to be placed on targets that were also assigned to other plates for the purpose of collecting repeat spectra.
- Fiber collisions occur when two objects are close enough together such that two holes cannot be drilled and plugged on the plate. In SDSS-I/II, the collision radius was 55". In BOSS, the collision radius is 62".
Changes to tiling within eBOSS
The same code used for BOSS tiling and fiber assignment was also used for eBOSS after a few modifications. The changes to the code were intended to increase the overall fiber efficiency in light of the decision to not include the ancillary science targets that often filled the remaining fibers in BOSS. The main eBOSS changes to tiling are:
- Tile centers were chosen using a subset of the main target samples in order to decrease the density of tiles. The LRG targets were artificially downsampled by roughly 15% when tile centers were established. The exact downsampling was tuned by hand for each run to obtain a tiling density of roughly 5 square degrees per tile. Once the tile centers were established, the full sample of LRG targets was used for fiber assignment.
- Multiple tiling rounds were used to assign fibers to primary science targets. For the main fields, quasar, TDSS, and SPIDERS targets were assigned in the first tiling round to achieve 100% completeness of decollided targets. LRGs were assigned fibers in a second tiling round using the remaining fibers. This sample averaged higher than 95% completeness on decollided targets, but did not achieve 100% as was required in the BOSS program.
- The ELG targets were isolated to a series of dedicated plates (identified by chunks eboss21, 22, 23, 25; see below for discussion of chunks). The target samples for these plates were dominated by ELG targets. TDSS objects were also included at a density of 10-15 fibers per square degree.
The tiling density of these plates averaged around 4 square degrees per tile.
Survey Footprint
Before describing the detailed geometry of the spectroscopic mask created by all the tiles and chunks, a simple place to start is the overall survey footprint. The figure below shows the survey footprint, which subtends 10,269 square degrees of sky. The spectroscopic observations for both BOSS and eBOSS were restricted to be within this footprint, although the spectroscopic plate coverage is not 100%. This is a subset of the DR8 imaging footprint, which covers 14,555 square degrees.
This area is found in the boss_survey.fits file in DR9.
 |
| Figure 1: Footprint of targets available for the BOSS and eBOSS Spectroscopic Surveys |
Tiling Chunks
Although the concept of a "tiling chunk" is discussed on the legacy page, the concept of a chunk is important for discussing the geometry of the survey, as well as the evolution of the target selection algorithms for galaxies and quasars in BOSS and eBOSS.
A chunk is a set of tiles—usually, but not always, a spatially contiguous set—that are designed all at the same time. Thus, the targets within a given chunk all come from a common target selection algorithm. The tiling solution, i.e., the distribution of tile centers, is determined for each chunk individually. Early chunks in BOSS and eBOSS were small, 50-100 plates. These chunks were kept small because target selection was evolving or because the planned footprint was evolving.
For an example, Figure 2 below shows the geometry of the chunk boss2. This chunk contains 47 plates and covers 144 square degrees. A sector is defined as a region covered by a unique set of tiles. Each sector in Figure 2 is color coded by the fraction of LRGs that were assigned fibers. The regions where the plates overlap have a significantly higher tiling completeness.
 |
| Figure 2: Geometry for chunk boss2 |
Figure 3 below shows the entire footprint of the BOSS survey, now color-coded such that each chunk is a distinct color. In this figure, boss2 is the dark blue chunk in the upper left-hand side of the image.
 |
| Figure 3: All BOSS chunks (as of 4/2012) |
Here is a chart showing the target selection algorithms (TSA) for galaxies, QSOs and standard stars for each chunk in BOSS. Each entry links to the boss target selection page, which details the various algorithms used to select targets from the imaging over the course of the survey.
| Chunk Name | Galaxy TSA | QSO TSA | Standard TSA |
|---|---|---|---|
| boss1 | comm | comm | comm |
| boss2 | comm2 | comm2 | comm2 |
| boss3 | main002 | main002 | main004 |
| boss4 | main002 | main002 | main004 |
| boss5 | main005 | main005 | main005 |
| boss6 | main005 | main005 | main005 |
| boss7 | main007 | main006 | main005 |
| boss8 | main007 | main006 | main005 |
| boss9 | main007 | main006 | main005 |
| boss10 | main007 | main006 | main005 |
| boss11 | main007 | vcat-2010-07-02 | main005 |
| boss12 | main008 | main008 | main005 |
| boss13 | main008 | main008 | main008 |
| boss14 | main008 | main008 | main008 |
| boss15 | main009 | main008 | main008 |
| boss16 | main009 | main010 | main008 |
| boss17 | main009 | main011 | main008 |
| boss18 | main009 | main012 | main008 |
| boss19 | main009 | main013 | main008 |
| boss20 | main009 | main013 | main008 |
| boss21 | main009 | main013 | main008 |
| boss22 | main009 | main013 | main008 |
| boss23 | main009 | main013 | main008 |
| boss24 | main009 | main014 | main008 |
| boss25 | main009 | main014 | main008 |
| boss26 | main009 | main014 | main008 |
| boss27 | main009 | main014 | main008 |
| boss28 | main009 | main015 | main008 |
| boss29 | main009 | main016 | main008 |
| boss30 | main009 | main016 | main008 |
Figure 4 below shows the tiled eBOSS footprint overlaid on the tiled BOSS footprint. The background tiles in gray represent the exact locations of BOSS tiles in RA and DEC. The orange tiles represent the SEQUELS program that was conducted in the transition between BOSS and eBOSS. The red tiles show the primary eBOSS fields that contained LRG and quasar targets. The blue tiles represent the fields that contain ELG targets.
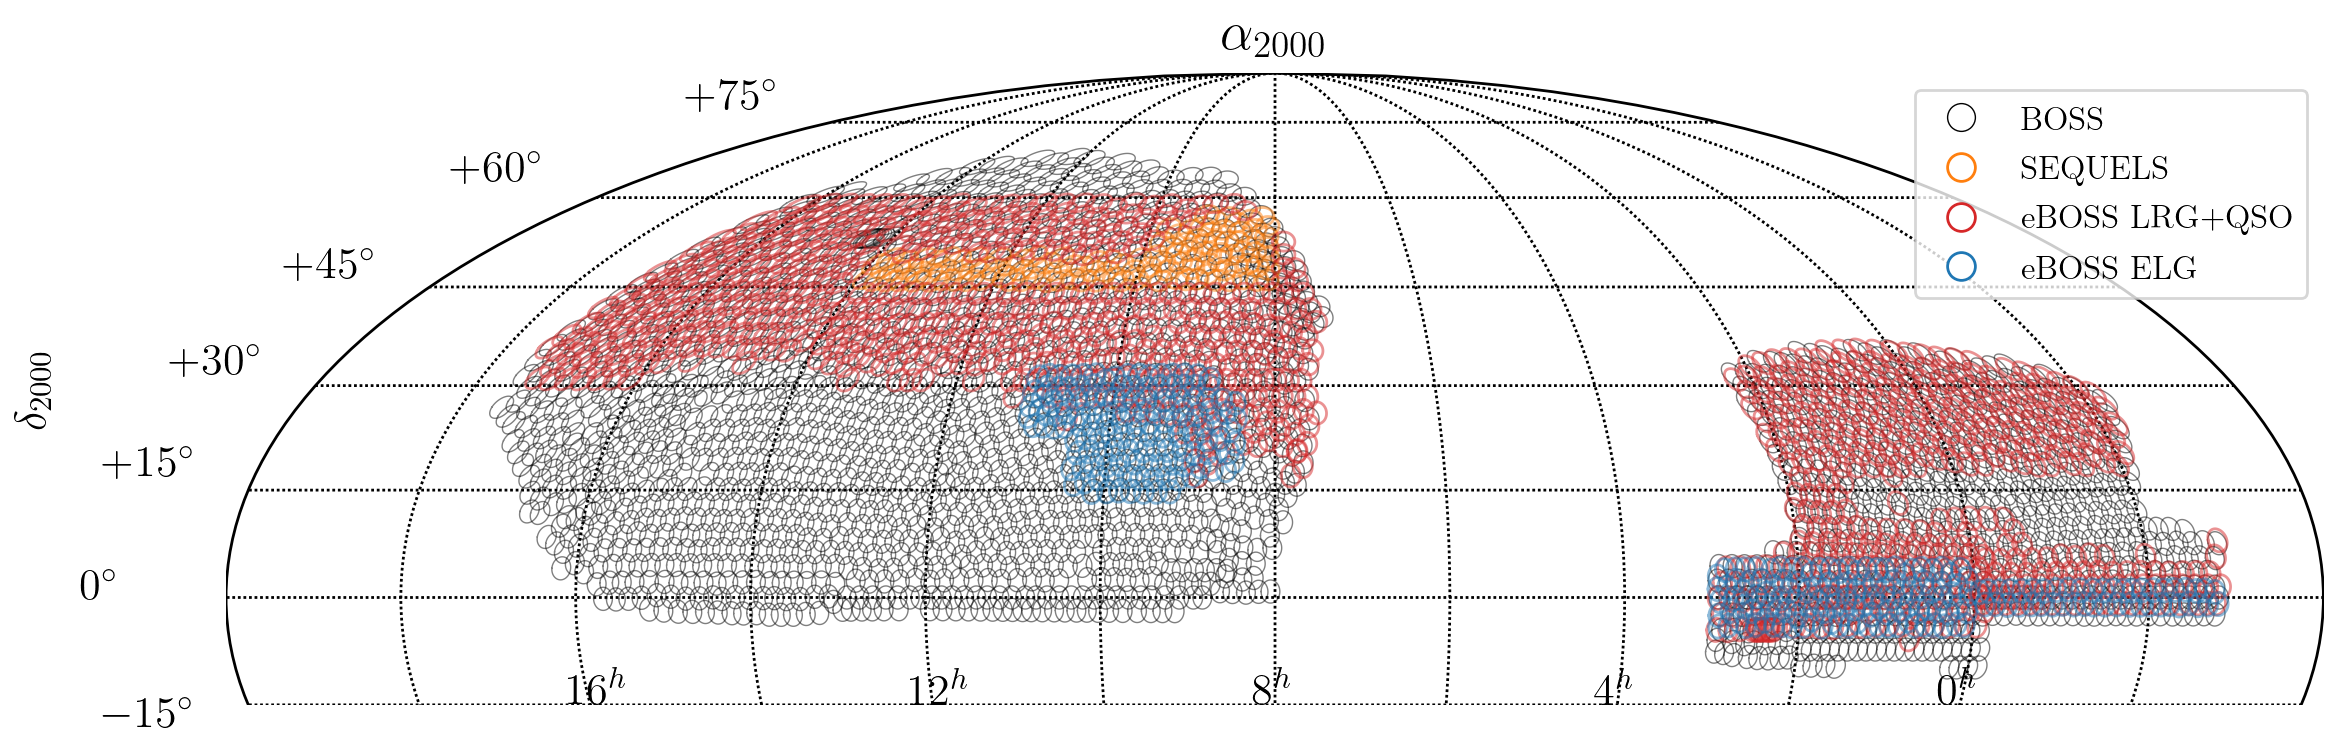 |
| Figure 4: eBOSS footprint, with exact placement of tiles. |
The eBOSS selection did not evolve between chunks. Rather, the goal for densities of targets on LRG/quasar plates was as follows:
- SPIDERS - 5 deg-2
- TDSS - 10 deg-2
- QSO_CORE - 90 deg-2
- QSO_REOBS - 10 deg-2
- QSO_PTF - 15 deg-2
- QSO_EBOSS_FIRST - 0.2 deg-2
- WD_STD - 0.5 deg-2
- LRG 50 deg-2
Manipulating Geometry with Mangle
All geometry files, or masks, are created using the software package mangle. To mangle, a mask is an arbitrary union of arbitrarily weighted angular regions bounded by arbitrary numbers of edges. The restrictions on the mask are only (1) that each edge must be part of some circle on the sphere (but not necessarily a great circle), and (2) that the weight within each subregion of the mask must be constant. For more information, check out mangle web page.
Here are a couple of examples of using the geometry files for the purpose of calculating a correlation function. In both examples, "polygonfile" can be the tiling geometry file discussed below. Note that the tiling geometry does NOT have weight set currently. Different users may define different sets of targets, thus this field is set to 1 everywhere as a default.
polyid [polygonfile] [list of targets (ra/dec)] polyid.out
This command takes a list of targets and tells you what polygon each target is in. This allows you to sum up the number of targets in each polygon to compute completeness values. This command can also be used with the veto mask (described at the end of this page) to remove targets and randoms from the sample as well.ransack -r100000 [polygonfile] ransack.out
This command creates 10,000 random points using the angular selection function defined in the polygonfile, outputted in ra and dec in the ransack.out file.
Tiling Geometry
The full tiling geometry of BOSS can be found here with a description of the fields given here.
The full tiling geometry of the eBOSS LRG-quasar program can be found here and the ELG program here.
Veto Masks
Some regions of the sky are not observable for myriad reasons. To create a consistent set of targets and a proper distribution of random points within they tiling geometry, the excluded areas within the survey are given in the veto masks. These veto masks are also created and manipulated with the mangle software. All of these masks are exclusion masks: if a random is within the mask, it should be vetoed. The veto masks include:
- Bright Star Mask
- Centerpost Mask
- Bad Field Mask
- Collision Priority Mask
Bright Star Mask
The bright star mask blocks out regions around bright stars in the Tycho-2 catalog. The radius of each masked region is a function of the apparent brightness of the star. For both galaxy and QSO targets, the bright star mask is used to remove targets from the list. No BOSS targets should be within the bright star mask; it should be used to remove randoms.
The bright star mask can be found here.
Centerpost Mask
The inner 92" of every plate has a hole for the centerpost. No target within 92" of a plate center can be assigned a fiber. The centerpost mask can be found here.
Bad Field Mask
Some imaging fields have bad photometry. Targets can still be located within bad fields, thus both targets and randoms within bad fields should be rejected. The bad field mask can be found here.
Collision Priority Mask
The collision priority mask places 62 arcsecond circles around all targets that have higher priority than the BOSS galaxy targets. Priority in this context refers to allocation of fibers in the event of a fiber collision. This mask is for all higher priority targets, regardless of whether they knocked out a galaxy target or not. It is in mangle polygon format. An example mask is available as a .ply file.

