
Massive Nearby Galaxies
Contact
| Renbin Yan |
|---|
| University of Kentucky |
| renbin@pa.uky.edu |
Summary
This program is aiming to target massive galaxies (with Mi brighter than -21.5) at lower redshifts than the MaNGA sample selection to build sample with comparable spatial resolution to low mass galaxies in the MaNGA sample.
Finding Targets
An object whose MANGA_TARGET3 or MNGTARG3 value includes one or more of the bitmasks in the following table was targeted for spectroscopy as part of this ancillary target program. See SDSS bitmasks to learn how to use these values to identify objects in this ancillary target program.
| Program (bit name) | Bit number | Target Description |
|---|---|---|
| Massive Nearby Galaxies | 12 | Massive |
Description
MaNGA’s main samples are selected in two narrow redshift bands in which redshift increases with increasing i-band luminosity. This was driven by the desire to have the same coverage in units of effective radius (Re) at all masses. This selection results in a luminosity-dependent spatial resolution: more luminous galaxies have poorer spatial resolution. Any analysis that studies mass/luminosity dependence of a physical property has to prove that any trend found is not caused by the changing resolution with stellar mass. The radial gradient measurement of many properties could also be sensitive to different physical resolution (e.g. Yuan et al. 2013). Therefore, we need a calibration set to provide constant physical resolution across all luminosities.
These massive galaxies do exist at lower redshift than the MaNGA primary sample selection cuts. Thus, it is possible to obtain higher spatial resolution for them at an expense of spatial coverage.
High spatial resolution is also very important to have on these massive galaxies for two science cases. First, these massive galaxies often have kinematically distinct cores (KDCs, Krajnović et al. 2011) with radii ranging from 0.2 to 3 kpc (McDermid et al. 2006). A resolution higher than MaNGA’s main galaxy sample is required to resolve these. Second, these galaxies are also the best candidates to host the most massive black holes in the Universe. Although the MaNGA resolution may not be enough to directly measure the black hole masses, we can provide the kinematic and spectral data to securely measure the central velocity dispersion, mass-to-light ratio profile, and surface density profile, to help identify candidates and provide supporting data for follow-up high resolution observations. This is important for building up the statistics at the upper end of the M-σ relation.
Target Selection
This sample is defined by an upper redshift limit and a luminosity limit.
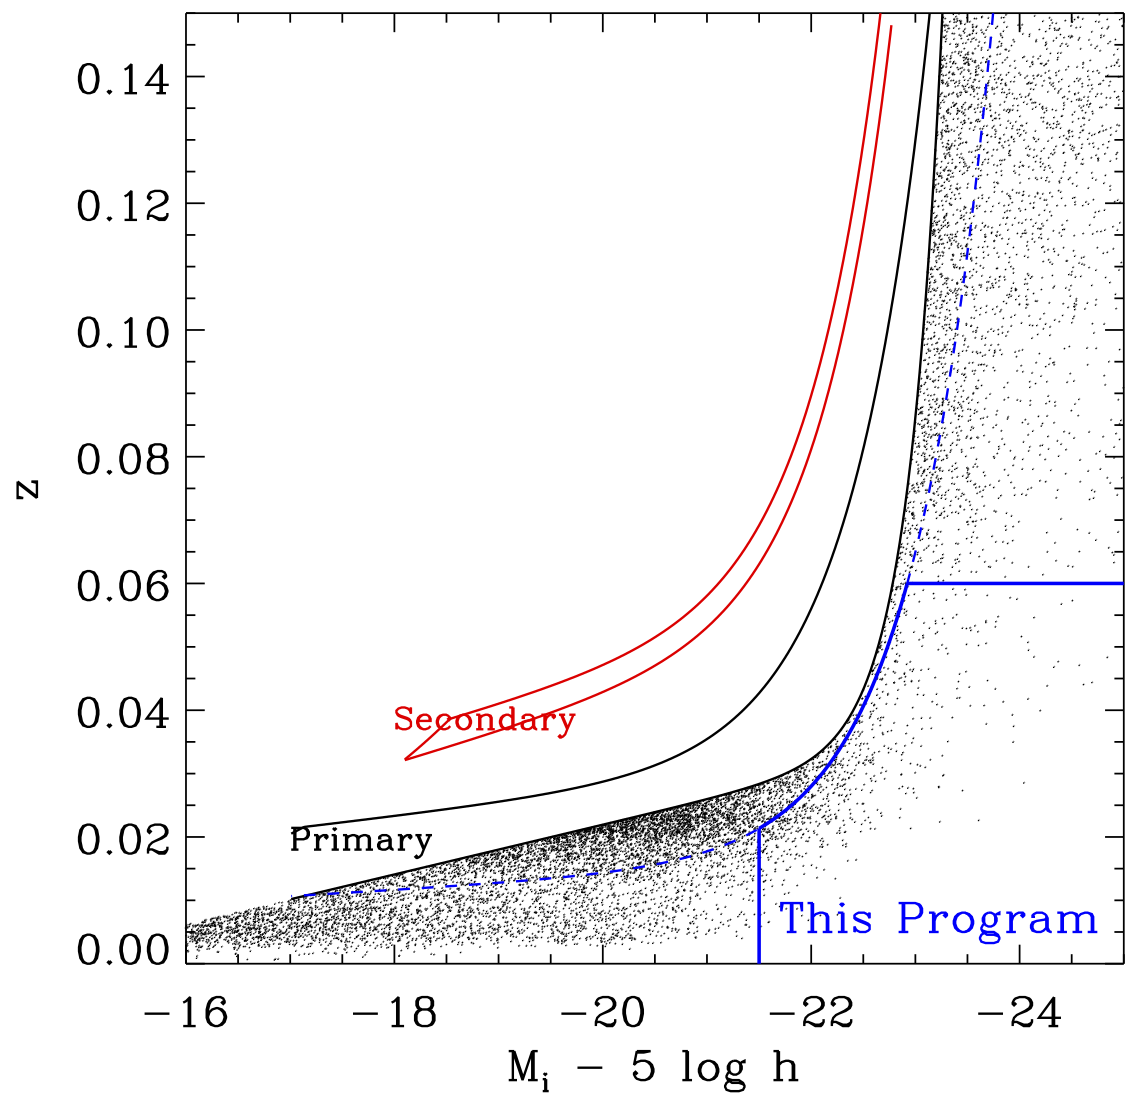
To define the redshift limit, we divide the upper redshift limit of MaNGA’s Primary sample by a factor of two. This guarantees that the sample selected this way will have a median resolution approximately twice better than those in the primary sample. We also apply an hard limit at z=0.06 to ensure spatial resolution better than 3kpc. The final luminosity-dependent redshift limit is the lower of the two.
We then apply a faint luminosity limit at Mi = -21.5 at which magnitude galaxies in our ancillary sample have similar spatial resolution as the faintest galaxies in the MaNGA Primary sample.
All objects in our sample have been visually inspected to remove problematic photometry due to artifacts or contamination by saturated stars.
This program is allocated a total of 75 IFUs. The sample selection and visual inspection results in a catalog of 310 objects. Only 1/4 of these will be observed. We assigned priorities to each target in the following way. First, all objects with i-band absolute magnitude brighter than -22.5 are assigned priority 1 (highest priority). There are 116 of these. About 1/3 of them will be covered by the final footprint, using ~38 IFUs. Second, all objects with i-band absolute magnitude fainter than -22.5 but brighter than -21.5 are assigned priority 2. There are 171 of these. These will probably use up the remaining IFUs allocated to our program. Priority 3 and 4 are objects whose photometry could potentially be affected by nearby stars, but through visual inspection appear OK. These were given lower priorities and are unlikely to be targeted.
REFERENCES
Krajnović et al., 2011, MNRAS, 414, 2923
McDermid et al., 2006, MNRAS, 373, 906
Yuan et al., 2013, ApJ, 767, 106

